![]()
Section 1
Sound — Signals,
Systems, and Sensation
Family, 1994. Reprinted with permission from the artist, Alan Rath, and Haines Gallery, San Francisco.
![]()
Audio Waveform 1
″Catch a wave
and you′re sittin′ on top of the world.″
— ″CATCH A WAVE,″ THE BEACH BOYS, SURFER GIRL (CAPITAL RECORDS, 1963)
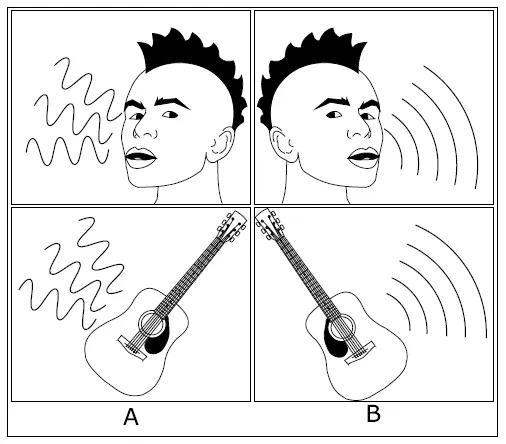
Ask a cartoonist to draw sound and they′ll likely come up with something quite similar to Figure 1.1. These sketches of sound have technical merit.
When a guitar is strummed, a drum struck, or a trombone blown, we know sound will follow. The motion of the soundboard of the guitar, the vibration of the heads of the drum, and the resonance of the air within the plumbing of the trombone ultimately drive the air nearest our eardrums into action. We hear the air vibrate near us due to a chain of events that started perhaps some distance away at any such musical instrument or sound source. It is a separate matter, but we likely hope the sound made is music.
1.1 Medium
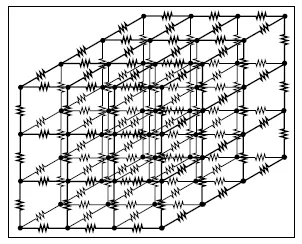
The air between a musical instrument and a listener is a springy gas. When squeezed together, it pushes back apart. If pulled apart, it snaps back together. Picture air as a three-dimensional network of interconnected springs, as in Figure 1.2. Any push or tug at just one point causes the whole system to jiggle in reaction. A continuous vibration of any one particle leads to a corresponding continuous vibration of the whole system. Motion of one element causes it to compress and stretch neighboring springs, which in turn push and pull against other springs further down the line.
Sound in air is a pressure wave with compressions (increases in air pressure) and rarefactions (reductions in air pressure) analogous to the squeezing together and stretching apart of elements of this vibrating spring system. Particles of air push and pull on one another very much as if connected by springs. Displace a bit of the air in one location, such as on-stage, and it causes a chain reaction throughout the space to the audience. As long as the source and receiver are near enough to each other, air motion at the instrument′s location will eventually cause, however faintly, a bit of air motion at the listener′s location.
Figure 1.1 A sketch of sound radiating outward from a source.
Slight increases in pressure occur when air particles are squeezed closer together. A loudspeaker cone, kick drum head, or piano soundboard moving toward the listener will do this. Decreases in pressure occur when air particles are pulled apart — the loudspeaker cone, kick drum head, or piano soundboard moving away from the listener.
1.2 Amplitude versus Time
The physiology and neurology associated with the human hearing system search constantly for changes in air pressure. Passing through the ear canal, changes in sound pressure push and pull on the ear drum, triggering a chain reaction that ultimately leads to the perception of sound. The pressure of a sound wave is the same type of air pressure associated with pumping air into a tire: PSI (pounds per square inch) in the some parts of the world, or kPa (kilopascals) else where. Micropascals (μPa) is the preferred order-of-magnitude expression of air pressure for sound that humans can healthily hear.
Figure 1.2 Air is a springy medium, like a three-dimensional network of springs.
A common way to graph sound plots air pressure as the vertical axis and time as the horizontal axis. Such a graph describes sound at a single, fixed location in space. As sound occurs, the air pressure at that point increases and decreases several times per second. The familiar plots of sound, in textbooks and comic books, accurately portray this concept.
Figure 1.1(a) shows sound as a squiggly line radiating from the sound source. Zoom in on the squiggly line and it might look like a sine wave as shown in Figure 1.3, or the more general waveform of Figure 1.4. A line is drawn to zig and zag, up and down, describing air pressure as it is occurs over time. The higher parts of the curve represent instances of increased pressure (compression), and the lower parts represent decreased pressure (rarefaction). A straight, horizontal line describes no change in pressure (i.e., no sound).
A lack of sound does not mean there is no air pressure, rather only that there is no change in air pressure. When the air pressure is unchanging, our eardrums aren′t moving. In other words, we have nothing to hear.
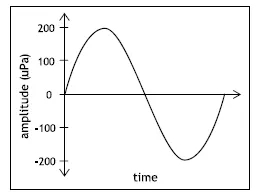
Figure 1.3 A pure tone — a sine wave.
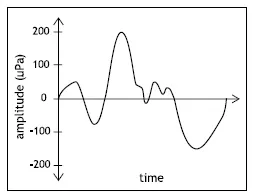
Figure 1.4 A general waveform.
The horizontal axis in these figures meets the vertical axis, not at a pressure of zero micropascals, but at the ambient atmospheric pressure around you today. The negative amplitudes in these curves represent a reduction in air pressure below ambient, not negative pressure. The air pressure is always positive; sound represents varying degrees of positive. The precise value of pressure where the x-axis meets the y-axis is not an audio concern; it is a matter for those who track weather. The ambient pressure published in weather reports is the centerline for the pressure oscillations of our music.
1.2.1 AMPLITUDE CONFUSIONS
Discussing the amplitude of a signal, it is natural to want to assign it a numerical value. Reducing the amplitude of a signal to a single number gets a little tricky. What is the amplitude of the signal shown in Figure 1.3? The plot shows that at its highest point, it reaches an amplitude of +200 μPa. Similarly, the lowest pressure shown is -200 μPa. One might correctly describe the signal as having a peak amplitude of 200 μPa or a peak-to-peak amplitude of 400 μPa. Because this signal is perfectly sinusoidal, the peak amplitude or the peak-to-peak amplitude fully describes the general amplitude of the signal, even though it is constantly changing. The amplitude of the waveform in between the peaks follows the known pattern of a pure tone.
The slightly more complicated waveform of Figure 1.4 unravels this amplitude notation methodology. Its positive peak is still 200 μPa, but its negative peak is -150 μPa, with several intermediate positive and negative peaks in between. If this signal is a musical waveform, it will surely keep changing shape, with local maxima and minima that change as the song plays. There is no single consistent positive or negative peak. As most audio signals lack the perfect symmetry of a sine wave, a better way to express the amplitude of an audio waveform is required.
Perhaps the average amplitude would be helpful. This approach is frustrated by the fact that audio spends about as much time above zero as below. In the case of the sine wave (see Figure 1.3), the average amplitude is exactly zero. No matter what the peak amplitude is (it may be raised or lowered by any amount), the average amplitude remains zero.
In search of a number that describes the amplitude and does not average zero, it might be tempting just to ignore the negative half of the wave. Averaging only the positive portion, a nonzero figure can at last be calculated. This remains problematic. The negative portion of the cycle also contributes to the perception of amplitude. Turning up the volume while music is being played causes the negative portion of the waveform to become more negative still. More extreme amplitudes, positive or negative, may be interpreted as louder. The more extreme air pressure changes lead to more extreme motion of the eardrum. Humans are impressed by amplitude whether a pressure reduction pulls the eardrum outward or a pressure increase pushes the eardrum inward. It′s amplitude either way. So the negative swings in air pressure must contribute to any numerical expression of amplitude as much as the positive ones, and, therefore, should not be ignored.
Musical signals, though lacking the perfect symmetry of a sine wave, share this tendency to average zero. The springy air, in reaction to the driving action of a loudspeaker, compresses and stretches. Each pressur...