![]()
1
About this Book
Phonetics is the study of speech. It is a broad and interdisciplinary science whose investigations cover four main areas:
- how speech can be written down (called phonetic transcription);
- how it is produced (speech production or articulatory phonetics);
- what its acoustic characteristics are (acoustic phonetics);
- how it is perceived by listeners (speech perception or auditory phonetics).
This book provides a coherent description of phonetics in these four areas. Each of these areas of phonetics is related to other scientific disciplines and has its own methodology. For example, the transcription of speech sounds is based on (supervised) introspection, careful listening, and speaking. The study of speech production and acoustics is related to physiology, anatomy, and physics. Finally, the study of speech perception is more oriented toward psychology. This book tries to familiarize the reader with important concepts of these other, sometimes rather “technical,” areas by means of everyday examples. This approach is based on the conviction that understanding is an important key to knowledge.
Given this range, this textbook is not only intended for students of phonetics or linguistics, but also for students of related disciplines such as psychology, computer science, medicine, speech pathology, and audiology – indeed, for anyone interested to learn more about how we speak and hear. Phonetics as the science of speech is not geared toward any particular language. Nonetheless, many examples are taken from English, simply because this book is written in English. We do, however, include many examples from other languages to illustrate facts not found in English, but in-depth knowledge of those languages by the reader is not required.
1.1 Phonetics in a Nutshell
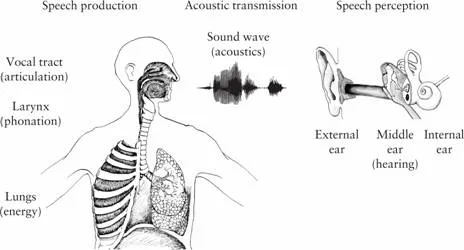
This section introduces some basic concepts of phonetics, which are explained in detail throughout the book. They are represented in Figure 1.1 and include, from left to right: the anatomical structures that enable us to speak, the acoustic signal that these structures produce, and the anatomical structures that enable us to hear.
The anatomical organs which play a role in speech production can be organized into three main areas (see left part of Figure 1.1): the lungs, the larynx, and the vocal tract, which itself consists of mouth, nose, and pharynx.
The lungs, which are used for breathing, are the main source of energy to produce speech sounds. Air that flows from the lungs outward has to pass through the larynx in the neck, where the vocal folds are located. The vocal folds can vibrate in the airstream and this gives the speech its pitch: the vocal folds in the larynx vibrate slower or faster when we produce a melody while we are speaking. This important process is called phonation, and speech sounds that are produced with vibrating vocal folds are called voiced sounds. The phrase “I lost my voice” actually refers to this process, since somebody who lost his voice is not completely silent but is rather whispering because his vocal folds do not vibrate. The area between the vocal folds is the source of many speech sounds; consequently, it has its own name, the glottis. Finally, the vocal tract (mouth, nose, and pharynx) are the central structures for producing speech sounds, a process which is called articulation. The structures involved in this process are called the articulators. The tongue is the most important organ here, and as the terms mother tongue or language (from the Latin word lingua ‘tongue’) indicate, this was well known by our ancestors.
Since the larynx has the role of a separator in this system, the part of the speech apparatus above the larynx is referred to as the supralaryngeal system and the part below it as the subglottal system.
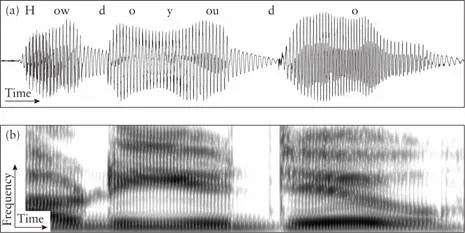
Speech sounds formed by the human vocal apparatus travel through the air as sound waves, which are essentially small air pressure fluctuations. In an oscillogram, these small fluctuations can be graphically represented with time on the horizontal x-axis and pressure at each instant in time on the vertical y-axis (see Figure 1.2a for an oscillogram of the sentence How do you do?). A surprising experience for many looking for the first time at a graphic representation of a speech signal is that there are no pauses between the words (like there are nice spaces between printed words) and that the sounds are not as nicely separated as letters are. In fact, speech sounds merge into each other and speakers do not stop between words. It actually sounds very strange if a speaker utters words with pauses between them (How – do – you – do) and in normal speech the phrase sounds more like howdjoudou with the dj like the beginning of the word jungle. This continuation of sounds and lack of breaks between words is one of the problems an adult learner of a foreign language faces: the native speakers seem to speak too fast and mumble all the words together – but this is what any speaker of any language does: the articulators move continuously from one sound to the next, and one word joins the next. The graphic display of this stream of sounds is therefore very helpful in the analysis of what actually has been produced.
If a sound is loud, its air pressure variations are large and its amplitude (i.e. the vertical displacement) in the oscillogram is high, just like an ocean wave can be high. If a sound wave repeats itself at regular intervals, that is, if it is periodic, then the signal in the oscillogram shows regular oscillations. If the sound is irregular, then the display of the signal on the oscillogram is irregular. And when there is no sound at all, there is just a flat line on the oscillogram. The oscillogram therefore is an exact reproduction of the sound wave.
Analyzing the signal and representing it in a spectrogram is often a useful method to gain further insight into the acoustic information transmitted by a speech signal (see Figure 1.2b for a spectrogram of the same utterance of Figure 1.2a). On a spectrogram, time is also displayed on the horizontal axis as in the oscillogram, but the vertical axis shows the energy in different pitch regions (or, more precisely, frequency bands). Frequency increases along the vertical axis, with higher frequencies displayed toward the top of the axis. In addition, intensity is represented by the darkness of the display, with areas of greater intensity showing up as darker parts of the spectrogram.
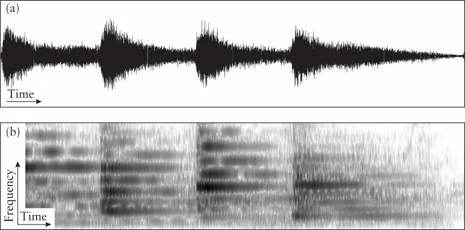
As a further example, Figure 1.3 represents the first half of the tune played by London’s “Big Ben” bell. The oscillogram (Figure 1.3a) shows that there are four acoustic events, but without further analysis it is not possible to differentiate the musical notes played by the bells. From the spectrogram, an experienced person could infer that the tones were produced by bells, and not, for example, by a trumpet, and determine the frequencies of the bells (what we perceive as their pitch). Comparing Figures 1.2 and 1.3, it is obvious that speech sounds are far more complex than the rather simple signals of bells.
The speech sounds eventually reach the ear of a listener (see right-hand side of Figure 1.1). The ear is not only the external structure on the side of the head, which is visible as the ear auricle, but includes the central hearing organ, which sits deep inside the head in the internal ear. The transmission of sound energy from the external ear to the internal ear is performed by a mechanical system in the middle ear that translates the airborne sound waves to pressure waves inside the fluidfilled cavities of the internal ear. Our brain, finally, makes sense of the signals generated by the sensory nerves of the internal ear and transforms them into the perception of speech. Although we cannot directly observe what is going on in this process, we can develop theories about the perception of speech and test these with clever experiments. This situation is somewhat similar to an astronomer who can make theories about a distant planet without actually visiting it. Unfortunately, our perception cannot be measured as easily as the physical properties of a signal, which we examine with an oscillogram or a spectrogram. For example, while it is easy to measure the amplitude of a signal, that is, how “high” sound waves are, this amplitude does not directly relate to the sensation of how “loud” a signal is perceived. This effect is well known by listening to music in a car on the highway and then stopping for a break: the music sounds extremely loud when the car is re-started after a few minutes. The physical amplitude of the signal is the same on the freeway and in the parked car, but the perception changes depending on the background noise and how long a person has been exposed to it.
All activities – producing, transmitting, and perceiving speech – are related to a sound wave and “run in real time”: if a DVD is paused, the picture can be frozen but the sound disappears. How, then, can speech sounds be described and captured on paper in order to talk about them? The oscillogram and spectrogram are ways to put signals on paper but they are not easy to understand and it is very complicated to infer from these pictures what a person has said. Normally, we write down the words that we hear, but we do this by knowing the spelling of a language, which might not be related to the way the words are pronounced. For example, the English words cough, though, through, and thorough all share the same letters – ough – but these letters are pronounced very differently. Thus, the orthography is often not a good way to represent the pronunciation of words. Therefore, speech sounds are “written” with the special symbols of the International Phonetic Alphabet (IPA). Some of these symbols look very much like the letters we use in writing, but these phonetic IPA symbols reflect sounds and not letters. To make this distinction obvious, IPA symbols are enclosed in square brackets. In this book, we use double quotation marks for letters. For example, the English word ski is written in IPA as [ski]. In our example, the words cough, though, through, and thorough are represented in IPA as [kɔf, ðoʊ, θɹu, ˈθʌɹə]. This writing with phonetic symbols is called phonetic transcription. And although this transcription may look foreign, it is obvious that the underlined sound sequences are different for these words and reflect the way the words are pronounced in this particular dialect of English. It is very important to keep this distinction in mind between the IPA symbols used for sounds and the letters that many languages use for writing.
Recall that Figure 1.2a shows a speech waveform (oscillogram) of the phrase How do you do?, which is a true representation of the air pressure fluctuations that make up this speech signal. When looking at such a waveform, it becomes clear that speech is not a sequence of isolated sound segments. Unlike printed characters that are a sequence of isolated letters grouped into words, nicely separated by spaces, a speech signal is a continuous, ever-changing stream of information. The transcription into sound segments is a rather artificial process that reflects our impression that speech is made up of a sequence of sounds. But even a single sound, like the consonant p in the word supper, is a complex event, that in a fraction of a second requires a precise coordination of the different muscle groups of the lips, tongue, and larynx. The outcome is a complex acoustic structure with different components, which are nevertheless perceived as one sound segment. On the other hand, even the removal of this sound segment from a speech stream leaves traces of its articulatory maneuvers in the adjacent speech segments, and the speech sound can often still be perceived after it has been removed from the signal. In this book, we explain how such a sound is produced, analyzed, perceived, and transcribed.
Additionally, there are other characteristics related to speec...