A variety of air pollutants are emitted into the atmosphere from human-caused and natural emissions sources throughout the United States and elsewhere. These contaminants impact sensitive natural resources in wilderness, including the national parks. The system of national parks in the United States is among our greatest assets. This book provides a compilation and synthesis of current scientific understanding regarding the causes and effects of these pollutants within national park lands. It describes pollutant emissions, deposition, and exposures; it identifies the critical (tipping point) loads of pollutant deposition at which adverse impacts are manifested.
- 638 pages
- English
- ePUB (mobile friendly)
- Available on iOS & Android
eBook - ePub
Air Pollution and Its Impacts on U.S. National Parks
About this book
Trusted by 375,005 students
Access to over 1.5 million titles for a fair monthly price.
Study more efficiently using our study tools.
Information
Section II
Case Studies
4
Great Smoky Mountains National Park and the Appalachian Highlands Network
4.1 Introduction
The Appalachian Highlands Network contains three national parklands that are larger than 100 mi2: Great Smoky Mountains National Park (GRSM), Big South Fork National River and Recreation Area (BISO), and Blue Ridge Parkway (BLRI). It also contains one smaller parkland: Obed Wild and Scenic River (OBRI). Larger parks generally have more available data with which to evaluate air pollution sensitivities and effects. In addition, the larger parks generally contain more extensive resources in need of protection against the adverse impacts of air pollution. Since air pollutants can be widespread, reduction of pollution emissions affecting large parks will often result in the protection of smaller parks located nearby as well. Within the Appalachian Highlands Network, effects of air pollutants on air quality–related values have only been well studied in GRSM. Figure 4.1 shows the network boundary, the location of each park, and population centers having more than 10,000 people.
Effects of air pollutants have been well documented in GRSM, including stream acidification, ozone symptoms on plant foliage, and high haze levels. Toxic air contaminants are not addressed in this chapter. This does not imply that metals and persistent organic pollutants are not important in this park, but rather that limited data are available with which to evaluate the levels and impacts of these contaminants.
GRSM is an international biosphere reserve and is the most heavily visited national park in the United States. The park contains the largest remaining area of old-growth spruce-fir forest in the conterminous United States (Shaver et al. 1994). Air pollution constitutes a major threat to the health of natural resources in this park, and elsewhere in the Appalachian Highlands Network. As a consequence, air pollution effects research in GRSM has been substantial. GRSM is designated as Class I, giving it a heightened level of protection under the Clean Air Act against harm caused by new emissions of air pollution.
4.2 Atmospheric Emissions and Deposition
Sulfur dioxide emissions and S deposition near and within the Appalachian Highlands Network have both been high. Malm et al. (2002) analyzed spatial patterns in atmospheric sulfate concentrations throughout the United States from 1988 to 1999 and also atmospheric sulfur dioxide emissions from 1990 to 1999. Based upon Interagency Monitoring of Protected Visual Environments (IMPROVE) data, the 90th percentile summer atmospheric sulfate concentrations were highest in the Ohio River Valley and in central Tennessee (generally upwind of GRSM), where emissions of sulfur dioxide have been especially high (Malm et al. 2002). Although S emissions have been substantially reduced over the past two decades by requirements of the Acid Rain Program, the Clean Air Interstate Rule, and other federal and state rules, the southern Appalachian Mountains region still has among the highest emissions levels in the country (Burns et al. 2011). These emissions have the potential to impact sensitive resources in GRSM and elsewhere in the network region. The network is surrounded by many large urban areas and point sources of both S and N emissions.
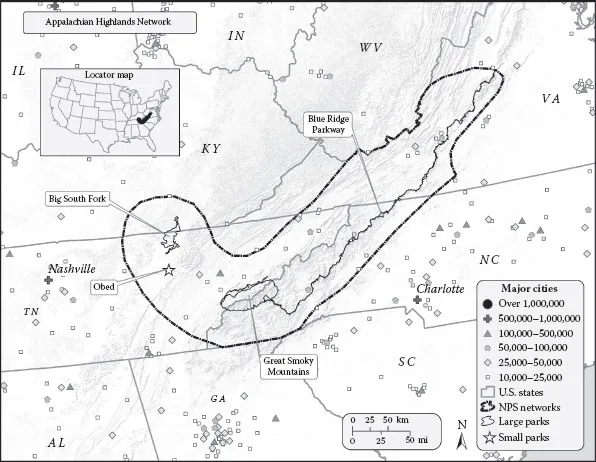
FIGURE 4.1
Appalachian Highlands Network boundary and locations of parks and population centers greater than 10,000 people.
Appalachian Highlands Network boundary and locations of parks and population centers greater than 10,000 people.
The atmospheric concentrations of sulfate in the GRSM region during the 1990s were twice as high as concentrations in the northeastern and coastal southeastern United States. However, emissions reductions have been enacted in more recent years in conjunction with federal rules, the North Carolina Clean Smoke Stacks Act, the Georgia Multipollutant Rule, and a legal settlement between North Carolina and the Tennessee Valley Authority. As a result, ambient atmospheric sulfur dioxide concentrations in the Southeast decreased by more than 50% between the periods 1989–1991 and 2007–2009 (Burns et al. 2011). Emissions for 1990–2013 can be found by state at http://www3.epa.gov/airmarkets/progress/reports/emissions_reductions_so2.html#figure2.
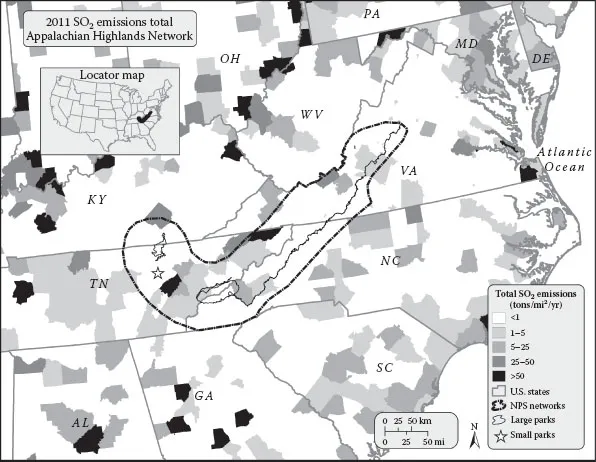
FIGURE 4.2
Total sulfur dioxide (SO2) emissions, by county, near GRSM for the year 2011. (Data from the EPA’s National Emissions Inventory, https://www.epa.gov/air-emissions-inventories, accessed January, 2014.)
Total sulfur dioxide (SO2) emissions, by county, near GRSM for the year 2011. (Data from the EPA’s National Emissions Inventory, https://www.epa.gov/air-emissions-inventories, accessed January, 2014.)
County-level emissions near GRSM, based on data from the EPA’s National Emissions Inventory during a recent time period (2011), are depicted in Figures 4.2 through 4.4 for sulfur dioxide, oxidized N, and ammonia, respectively. Several counties to the north and west of GRSM had relatively high sulfur dioxide emissions (>50 tons/mi2/yr; Figure 4.2). Spatial patterns in oxidized N emissions were generally similar, with highest values to the northwest of the park (Figure 4.3). Emissions of ammonia near the park were somewhat lower, with most counties showing emissions levels below 8 tons/mi2/yr (Figure 4.4).
Total wet plus dry S deposition throughout much of GRSM ranged from about 10 to 15 kg/ha/yr in 2002 (Sullivan et al. 2011) but has since declined. Some locations near the park had estimated wet plus dry S deposition higher than that. Total wet plus dry N deposition within the network ranged from as low as 2 to 5 kg N/ha/yr to as high as 10 to 15 kg N/ha/yr (Sullivan et al. 2011). In addition, it is known that cloud (a type of occult) deposition, which is not represented in the total deposition values depicted on the maps shown here, can be quite high at sites having elevation greater than 1500 m (4921 ft) that occur in and around GRSM. At the highest-elevation locations, the total S and N deposition, including cloud inputs, might each be as much as double the wet plus dry deposition values shown on the maps. However, because of more recent large emissions reductions achieved by the Acid Rain Program and other air quality improvement programs, total S deposition decreased about 40% in the Southeast between the periods 1989–1991 and 2007–2009 (Burns et al. 2011). Total N deposition decreased about 19%. This more modest decrease in N deposition reflects the fact that air quality management programs for N focused only on oxidized N sources (vehicles, power plants, industry); ammonia sources (agriculture, feedlots), which also contribute to total N deposition, are largely unregulated.
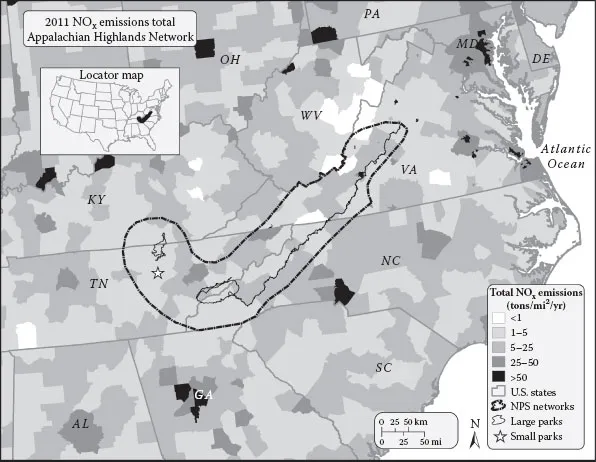
FIGURE 4.3
Total oxidized nitrogen (NOx) emissions, by county, near GRSM for the year 2011. (Data from the EPA’s National Emissions Inventory, https://www.epa.gov/air-emissions-inventories, accessed January, 2014.)
Total oxidized nitrogen (NOx) emissions, by county, near GRSM for the year 2011. (Data from the EPA’s National Emissions Inventory, https://www.epa.gov/air-emissions-inventories, accessed January, 2014.)
Atmospheric S, and to a lesser extent N, deposition levels have continued to decline at GRSM since 2001, based on Total Deposition project estimates (Table 4.1). Decreases in total S deposition over the previous decade averaged nearly 43%. Estimated total N deposition decreased over that same time period by 0.79 kg N/ha/yr (−7.4%). Oxidized N and ammonium deposition showed opposite patterns, with oxidized N decreasing and ammonium increasing since the monitoring period 2000–2002. Total S deposition in and around GRSM for the period 2010–2012 was generally highest (>10 kg S/ha/yr) to the northwest and lowest (<5 kg S/ha/yr) to the southeast of the network area (Figure 4.5).
Oxidized inorganic N deposition for the period 2010–2012 was in the range of 5–10 kg N/ha/yr throughout much of the park. Most areas received about 2–5 kg N/ha/yr of ammonium from atmospheric deposition during this same period; total N deposition was in the range of 10–15 kg N/ha/yr at most park locations (Figure 4.6). Other areas received 5–10 kg N/ha/yr of total N deposition.
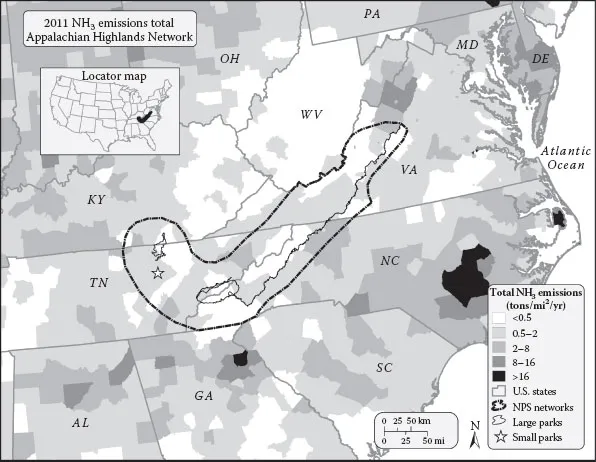
FIGURE 4.4
Total ammonia (NH3) emissions, by county, near GRSM for the year 2011. (Data from the EPA’s National Emissions Inventory, https://www.epa.gov/air-emissions-inventories, accessed January, 2014.)
Total ammonia (NH3) emissions, by county, near GRSM for the year 2011. (Data from the EPA’s National Emissions Inventory, https://www.epa.gov/air-emissions-inventories, accessed January, 2014.)
TABLE 4.1
Average Changes in S and N Depositiona between 2001 and 2011 across Park Grid Cells at GRSM
Average Changes in S and N Depositiona between 2001 and 2011 across Park Grid Cells at GRSM
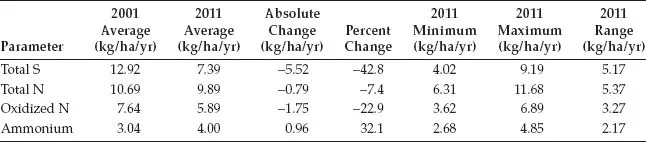
a Deposition estimates were determined by the Total Deposition project, based on three-year averages centered on 2001 and 2011 for all ~4 km grid cells in each park. The minimum, maximum, and range of 2011 S and N deposition within each park are also shown.
Weathers et al. (2006) developed an empirical modeling approach, based on 300–400 throughfall measurements, to estimate the total (wet, dry, cloud) deposition of S and N to complex terrain of GRSM. Throughfall deposition measurements are based on samples of precipitation that have dripped through the canopy and been captured near ground level during summer. The data on water concentration and amount, combined with landscape variables, such as elevation, forest type, and slope, explained about 40% of the variation in total deposition estimates. Model estimates were scaled to measured wet and estimated dry deposition values from National Atmospheric Deposition Program and Clean Air Status and Trends Network monitoring sites, respectively. Resulting maps showed substantial spatial variability, with high values of 31 kg N/ha/yr and 42 kg S/ha/yr across the landscapes of this park. Thus, atmospheric loadings of both S and N at high-elevation locations in GRSM have been among the highest of any wildland area in the United States. Much of this deposition has been from dry and cloud deposition processes, which are particularly efficient modes of deposition in spruce-fir forests along the ridge tops. Because of recent emissions reductions, these modeled deposition estimates do not reflect current conditions but are important in assessing the long-term effects of acid deposition in this park.
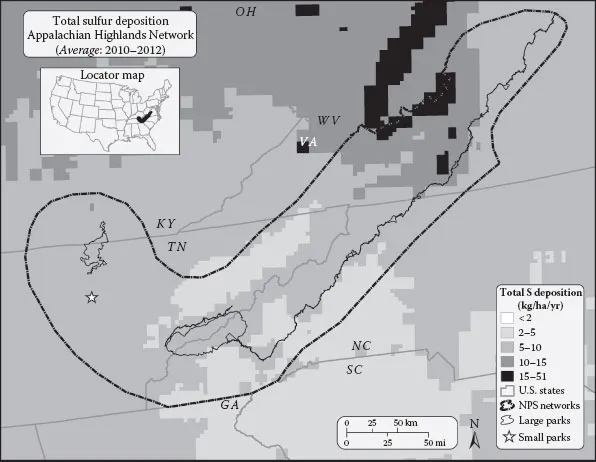
FIGURE 4.5
Total S deposition for the three-year period centered on 2011 in and around GRSM. (From Schwede, D.B. and Lear, G.G., Atmos. Environ., 92. 207, 2014.)
Total S deposition for the three-year period centered on 2011 in and around GRSM. (From Schwede, D.B. and Lear, G.G., Atmos. Environ., 92. 207, 2014.)
Cloud water deposition was measured at three high-elevation sites in the Appalachian Mountains in the Mountain Acid Deposition Program. One of those sites was at Clingmans Dome in GRSM. Seasonal cloud water deposition at that site was very high for both sulfate (>50 kg/ha) and N oxides (>25 kg/ha). Baumgardner et al. (2003) concluded that total deposition of acidic anions at high elevation (>1500 m) in GRSM may be 6–20 times higher than the deposition at low elevation, with this difference mainly attributed to cloud deposition at the high elevations.
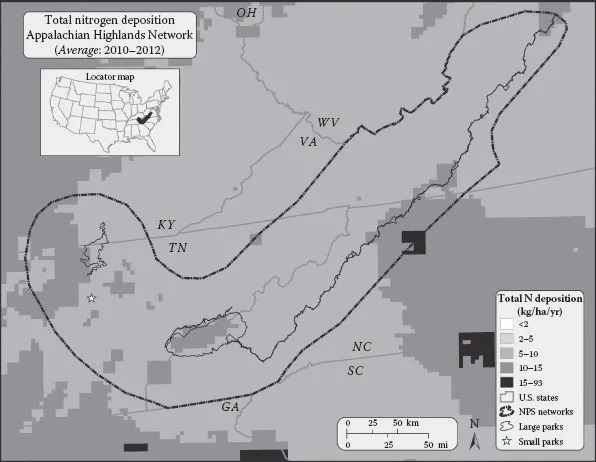
FIGURE 4.6
Total N deposition for the three-year period centered on 2011 in and around GRSM. (From Schwede, D.B. and Lear, G.G., Atmos. Environ., 92. 207, 2014.)
Total N deposition for the three-year period centered on 2011 in and around GRSM. (From Schwede, D.B. and Lear, G.G., Atmos. Environ., 92. 207, 2014.)
Atmospheric deposition of Hg is also important for resource protection in GRSM. The National Park Service (2010) reported long-term trends in concentrations of Hg in wet deposition during the periods beginning in 1996–2003, and running through 2008, for nine national parks. Three-year means of annual Hg concentration in wet deposition were reported by the National Park Service (2010) for 13 parks that had at least two years of valid data during the period 2006–2008. The highest Hg concentration in precipitation was reported for Everglades National Park in South Florida, followed by GRSM. More recent data are available through the Mercury Deposition Network of the National Atmospheric Deposition Program (http://nadp.sws.uiuc.edu/mdn/). There are two Hg deposition monitoring sites in GRSM, at Elkmont (since 2002) and Clingmans Dome (since 2015).
4.3 Acidification
4.3.1 Acidification of Terrestrial Ecosystems
Some research has been conducted within the GRSM region on the effects of S and N on lichens. McCune et al. (1997) found air pollution–tolerant epiphytic lichen species to be present, along with relatively low epiphytic lichen species richness, in urban and industrial areas within Georgia, North Carolina, South Carolina, Tennessee, and Virginia. In contrast, air pollution–sensitive species were more common, and richness was higher, in rural areas. These effects on lichens may be due to both acidification and nutrient enrichment impacts of enhanced S and N input.
Land cover within GRSM is primarily forested. These forests contain vegetation types that include red spruce and sugar maple, two tree species thought to be especially sensitive to acidification and accompanying soil base cation depletion (U.S. EPA 2008a). Much of GRSM is covered by vegetation types likely to contain either red spruce or sugar maple, wi...
Table of contents
- Cover
- Half Title
- Title Page
- Copyright Page
- Dedication
- Table of Contents
- List of Figures
- List of Tables
- Preface
- Acronyms and Abbreviations
- Acknowledgments
- Author
- Section I Background
- Section II Case Studies
- Index
Frequently asked questions
Yes, you can cancel anytime from the Subscription tab in your account settings on the Perlego website. Your subscription will stay active until the end of your current billing period. Learn how to cancel your subscription
No, books cannot be downloaded as external files, such as PDFs, for use outside of Perlego. However, you can download books within the Perlego app for offline reading on mobile or tablet. Learn how to download books offline
Perlego offers two plans: Essential and Complete
- Essential is ideal for learners and professionals who enjoy exploring a wide range of subjects. Access the Essential Library with 800,000+ trusted titles and best-sellers across business, personal growth, and the humanities. Includes unlimited reading time and Standard Read Aloud voice.
- Complete: Perfect for advanced learners and researchers needing full, unrestricted access. Unlock 1.5M+ books across hundreds of subjects, including academic and specialized titles. The Complete Plan also includes advanced features like Premium Read Aloud and Research Assistant.
We are an online textbook subscription service, where you can get access to an entire online library for less than the price of a single book per month. With over 1.5 million books across 990+ topics, we’ve got you covered! Learn about our mission
Look out for the read-aloud symbol on your next book to see if you can listen to it. The read-aloud tool reads text aloud for you, highlighting the text as it is being read. You can pause it, speed it up and slow it down. Learn more about Read Aloud
Yes! You can use the Perlego app on both iOS and Android devices to read anytime, anywhere — even offline. Perfect for commutes or when you’re on the go.
Please note we cannot support devices running on iOS 13 and Android 7 or earlier. Learn more about using the app
Please note we cannot support devices running on iOS 13 and Android 7 or earlier. Learn more about using the app
Yes, you can access Air Pollution and Its Impacts on U.S. National Parks by Timothy J. Sullivan in PDF and/or ePUB format, as well as other popular books in Biological Sciences & Ecology. We have over 1.5 million books available in our catalogue for you to explore.