![]()
1
INTRODUCTION AND OVERVIEW
Gary A. Adams and Kenneth S. Shultz
In the current chapter we seek to set the stage for those that follow. We begin by introducing both population aging and labor force participation as the key trends that lead to an aging workforce. Then we discuss current projections surrounding labor force participation rates of older workers and the impact of these on the size and composition of the workforce. Following this, we describe how the text unfolds and we highlight some of the key findings and issues raised by each chapter. In doing so, we provide the reader with a broad view of aging and work in the 21st century and a sense of the interconnectedness of the topics covered.
The Aging Population
The world’s population was gradually aging over the second half of the last century and it will continue to do so at an accelerating rate well into the 21st century (United Nations, 2017). Between 1950 and 2000 the median age of the population worldwide increased from 24 years old to 27 years old, and it is projected to increase rapidly through 2050 when it will reach 37 years old. In more developed countries the median age has already risen quickly – from 29 years old in 1950 to 37 years old in 2000, and it is projected to reach 45 years old by 2050. In less developed countries those ages have increased from 21 years old in 1950 to 24 years old in 2000, and to 35 years old by 2050 (projected). Both the absolute increase in the age of the population and the rate at which population aging is occurring is unprecedented in recorded history (United Nations, 2017).
The key driver of population aging is a pattern of fertility and mortality rates that occur over time, generally referred to as demographic transition (Thompson, 1929). As nations and societies develop, they experience decreasing fertility rates (births) and decreasing mortality rates (deaths). This pattern occurs as the result of improvements in health, education, and socioeconomic status, as well as increased economic opportunity that accompany development. A fertility rate of 2.1 births per woman is necessary to stabilize a population. This is the replacement rate. Decreasing fertility rates reduce the number of young people in subsequent cohorts. As the fertility rate approaches and falls below the replacement rate, the number of young people in subsequent age cohorts drops precipitously and they become fewer in number than the number of older people in the population. Decreasing mortality has the effect of leaving more people alive to reach older ages and also by extending the number of years in old age that they will live. The combination of successively smaller numbers of younger people and larger, longer-living numbers of older people results in population aging.
These aging trends are well underway worldwide. The global fertility rate has dropped from 4.5 live births per woman in the 1970–1975 timeframe to 2.5 in 2010–2015 and it is expected to decline to 2.4 by 2025–2030 (United Nations, 2015). Further, nearly half of the world’s population lives in countries with near or below replacement rate fertility levels. These include all of Europe, North America, and almost all of Asia, as well as Latin America and the Caribbean. With regard to mortality declines, the average life expectancy around the world in 1950 was 47 years old, but by 2000 that number had risen to 65 years old and it is projected to reach 76 years old by 2050. These trends result in a larger older population. As He, Goodkind, and Kowal (2015) report, between 2015 and 2050 the number of people in the world over the age of 65 is projected to increase from 617.1 million to 1.6 billion. In terms of their share of the world’s total population, while people over the age of 65 accounted for 8.5 percent of the world’s 7.2 billion people, it is expected that they will account for 16.7 percent of the world’s 9.3 billion people by 2050. Over this same period the number of young people (under the age of 19) will remain relatively unchanged and the share of the world’s population held by those in the prime working years (ages 20–64) will decrease slightly. Although there are differences across countries in the rate at which the demographic transition process is proceeding, every country in the world is affected by it.
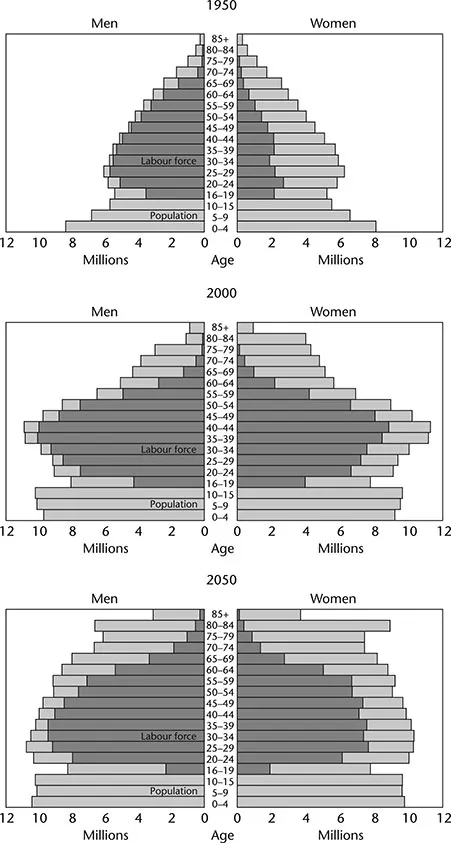
For specific countries, such as the US, demographic transition and immigration influence the size and age distribution of the population. Figure 1.1 presents age and sex population ‘pyramids’ for the United States in 1950, 2000, and 2050 (projected). Looking across the three time periods, several trends are evident. First, the overall size of the population will grow over the course of the three time periods, but the growth will occur more slowly between 2000 and 2050. It should be noted that more than half of that growth is expected as a result of immigrants (who tend to be younger) coming to the country. Second, in 1950, most of the population were in their 20s and 30s and there were progressively fewer people in each of the older age groups above them. Third, the largest sized age group in 1950 was in the youngest age category. This reflected the start of the post-World War II baby boom – that time from 1946 to 1964 during which fertility rates were generally high and some 80 million people were born in the US. The progressive aging of the baby boom cohort can be seen in the very large middle age categories in 2000 and in the oldest age categories by 2050. Between 2000 and 2050 those over the age 65 are expected to more than double and the average age of the population in the US will increase from approximately 35 to 41 years old (United Nations, 2017). Importantly, as these numbers indicate, and can be seen in the population pyramid for 2050, the effects of demographic transition will be felt even after the baby boom cohort has passed through the oldest age categories. Thus, although the US population is still growing, it is growing older and will continue to do so well into the 21st century.
FIGURE 1.1 US population/labor force pyramid by gender.
The Aging Workforce
By establishing the pool of available workers, the age structure of the population overall is the main determinant of the age of the workforce at present and what it is likely to be in the future. However, a number of factors in addition to the population structure also help determine the size, composition, and other features of the workforce. Chief among these are the workforce participation rate. The workforce participation rate is the ratio of people working, or actively looking for work, relative to those who could be working or looking for work. Unlike population projections that are based on known fertility and mortality rates, workforce participation rates are much more variable and influenced by a broader array of factors related to both workers and the workplace. Differences in participation rates across various groups (e.g., age groups) help determine the demographic composition of the workforce. Below, we highlight some of the key historical trends and projections surrounding the size of the workforce and participation rates that determine its composition.
Like the US population overall, the workforce has and will continue to grow over time. In the US, between 1950 and 2000, the workforce more than doubled from 62 million workers to 142 million workers, and by 2050 the workforce is expected to grow to approximately 200 million workers (Toossi, 2012). However, changes in workforce participation affect the rate at which the workforce grows. As can be seen in Figure 1.1, between 1950 and 2000 the US workforce grew at a considerable rate. This was especially true from 1960 to 1980 when workforce growth rates were as high as 2.6 percent (Toossi, 2012). This growth was fueled in large part by high workforce participation among the baby boomers as they entered their prime work years. Between 1950 and 2000 the overall workforce participation rate increased from 59 percent to 67 percent. Looking forward however, the workforce participation rate is expected to decrease to 58 percent by 2050. As a result, the workforce is expected to grow older and at a much slower pace (<1 percent) than in previous decades (Toossi, 2012).
Differences in workforce participation rates across age groups help determine the age composition of the workforce. Based on data from the Bureau of Labor Statistics (Toossi, 2016; Toossi & Torpey, 2017) for most of the second half of the last century workforce participation by younger and prime working age workers had increased. For example, in 1950, participation among those age 16–24 and 25–54 was 60 percent and 66 percent respectively. By the 1990s those numbers had climbed to 67 percent and 84 percent. At that same time workforce participation among those over the age of 55 declined from 43 percent to 30 percent. Since that time these trends have seen a complete reversal. Workforce participation among younger workers has decreased, and especially so for workers age 16–24 (down to 55 percent), while workforce participation among older workers has increased (up to 40 percent). Looking to 2050, the growth of the workforce among those 24–54 years old is expected to remain relatively flat and, for those who are 16–24, it is actually expected to decline. However, during this same time those over the age of 55 will be the fastest growing age group and this is especially true for those over the age of 65. As a result, those over the age of 55, who accounted for 13 percent of the workforce in 2000, are expected to make up 24 percent of the workforce by 2050.
One factor underlying increased workforce participation among older workers has been the transformation that has taken place around the concept of retirement (Shultz & Wang, 2011). Beginning around 1950, retirement generally came to be viewed as a period of leisure that followed labor force exit after a lifetime of work (Feldman, 1994) and increasingly earlier retirement ages became common (at least among men). However, by the 1990s that trend toward earlier retirement ages had come to an end (Cahill, Giandrea, & Quinn, 2006) and for many older workers retirement characterized as a period of nonwork leisure also changed. Retirement began to involve various forms of work referred to as bridge employment (Shultz, 2003, Beehr & Bennett, 2015), which may involve continuing full-time or part-time work with the same or different employers, in the same or different career field, self-employment (Wang, Adams, Beehr, & Shultz, 2009) and ‘unretirement’ – returning to work after having been retired (Cahill, Giandrea, & Quinn, 2013). Concerns regarding personal finances, changes to public and private pension systems, better health and education, and changes in work that make it less physically demanding along with a desire to remain active and engaged have all increased the number of workers engaging in bridge employment and unretirement. This period of employment among older workers has already become important and common enough to be conceptualized as a late life career stage (Wang et al., 2009; Wang, Olson, & Shultz, 2013). Research suggests that these trends surrounding increased levels of bridge employment and unretirement are likely to continue with estimates suggesting that between 53 percent (Collinson, 2017) and 79 percent (Greenwald, Copeland, & VanDerhei, 2017) of current workers indicate that they plan to work during their retirement years. In summary, there are more older workers and they are staying in the workforce longer than before.
Workforce participation rates also affect the composition of the aging workforce in terms of sex and racial/ethnic diversity. Owing to changing social and cultural norms, legal protections, and economic conditions, women have increased their participation in the work force considerably over the past half century. Again, as can be seen in Figure 1.1, in 1950 only about one-third of women participated in paid work, but by 2000 that percentage had doubled. During that same time, men’s workforce participation rate declined from over 86 percent in 1950 to just under 75 percent in 2000. These changes in workforce participation rates had the effect of changing the composition of the workforce such that women constitute a more equal share of the workforce relative to men. As these women grow older, they are likely to continue to participate in the workforce. In fact, workforce participation among women over the age of 65 has doubled since 2000 (Toossi & Morisi, 2017) and this group is expected to have the largest percentage increase in workforce participation of any age group in the coming decades (Bureau of Labor Statistics, March, 2017).
Regarding racial and ethnic diversity, as the population of the US has become more diverse, so too has the workforce. Although presently concentrated at younger ages relative to non-Hispanic whites, people with diverse backgrounds will also grow older during the 21st century. For example, while the share of the population over the age of 65 will increase, it is projected that between 2010 and 2050 this increase will be especially pronounced among racial and ethnic groups other than non-Hispanic whites (Colby & Ortman, 2014). With regard to the workforce, approximately 78 percent of the workforce is currently made up of non-Hispanic whites (Bureau of Labor Statistics, November, 2017). However, workforce participation rates among, for example Hispanics (65.9 percent) are higher than they are for non-Hispanic whites (62.8 percent; Bureau of Labor Statistics, September, 2016). Taken together, an increase in the number of people with diverse racial and ethnic backgrounds in the population combined with higher workforce participation rates suggests that these groups will expand their share of the aging workforce considerably in the future.
Overview to the Book
The dramatic, accelerating, and inevitable demographic shifts happening worldwide, in both the general population and workforce, as outlined above, necessitates a renewed look at the aging workforce in the 21st century. The implications of these shifts for a wide variety of issues, from human resources practices of hiring and retention, to training, to increasing the levels of work engagement of workers as they age, will be dramatic. Thus, we now outline and overview the key issues discussed in each of the subsequent chapters in this revised and updated edition of Aging and Work in the 21st Century.
In one of the several new chapters in this edition of the book, Chapter 2 by Mary Anne Taylor examines programs and practices aimed at recruiting and retaining older workers. She begins by describing how the aging workforce is contributing to the growing mismatch between the supply of skills in the labor pool and the demand for skills on the part of organizations. She then adopts a talent management perspective, which emphasizes the importance of maximizing outcomes for both workers and organizations, to recommend a four-step process that involves (1) planning, (2) designing, (3) implementing, and (4) evaluating programs for recruiting and retaining older workers. For each of these steps she identifies the issues that must be considered and reviews the research surrounding them. She also calls for a greater recognition of the heterogeneity among aging workers on the part of both researchers and practitioners interested in attracting and retaining older workers in the workforce.
In Chapter 3, Jennica Webster, Christian Thoroughgood, and Katina Sawyer, in another chapter new to this edition, on the topic of diversity, address some of the most important issues regarding heterogeneity among older workers. In their chapter, Webster, Thoroughgood, and Sawyer develop a life-span intersectionality approach to the topic of diversity among aging workers. From a lifespan perspective, they call attention the cumulative effects of lifelong experiences of classic, overt, and modern forms of discrimination (e.g., microaggressions) on the part of workers from diverse backgrounds that impact them differently as those workers age. They use the intersectionality perspective to examine stereotypes associated with age in combination with stereotypes associated with other diverse identities. More specifically they examine how stereotypes of older workers might combine with stereotypes about visible stigmatized identities including gender and race/ethnicity, as well as ‘invisible’ stigmatized identities such as sexual orientation and gender identity. Recognizing that age can combine with these other stigmatized social identities to doubly or triply stigmatize older workers allows for a more nuanced approach to the experience of aging and work that can lead to better research on aging workers and practical solutions to the issues that they confront.
Continuing on the theme of stereotypes, Chapter 4 by Lisa Finkelstein, Elizabeth Hanrahan, and Courtney Thomas provides an expanded and ...