Today autism has become highly visible. Once you begin to look for it, you realize it is everywhere. Why? We all know the answer or think we do: there is an autism epidemic. And if it is an epidemic, then we know what must be done: lots of money must be thrown at it, detection centers must be established and explanations sought, so that the number of new cases can be brought down and the epidemic brought under control.
But can it really be so simple? This major new book offers a very different interpretation. The authors argue that the recent rise in autism should be understood an "aftershock" of the real earthquake, which was the deinstitutionalization of mental retardation in the mid-1970s. This entailed a radical transformation not only of the institutional matrix for dealing with developmental disorders of childhood, but also of the cultural lens through which we view them. It opened up a space for viewing and treating childhood disorders as neither mental illness nor mental retardation, neither curable nor incurable, but somewhere in-between. The authors show that where deinstitutionalization went the furthest, as in Scandinavia, UK and the "blue" states of the US, autism rates are also highest. Where it was absent or delayed, as in France, autism rates are low.
Combining a historical narrative with international comparison, The Autism Matrix offers a fresh and powerful analysis of a condition that affects many parents and children today.
- English
- ePUB (mobile friendly)
- Available on iOS & Android
eBook - ePub
About this book
Trusted by 375,005 students
Access to over 1.5 million titles for a fair monthly price.
Study more efficiently using our study tools.
Information
1
THE PUZZLE OF VARIATION IN AUTISM RATES
Autism may be everywhere, but it is not found everywhere at the same rate. When it comes to the autism epidemic, all U.S. states were not created equal. American readers should know that the chances their own children will be categorized and served as “autistic” by school boards are about twenty-two times higher if they live in Maine than if they live in Oklahoma. As the readers can see in Table 1, some states – Maine, Massachusetts, Minnesota, Oregon – diagnose children between the ages of 3 and 5 as autistic, and provide them with special education services, at rates that are much higher than the national average of 29 in 10,000 (for this age group in 2006) while other states – Mississippi, Iowa, Oklahoma, West Virginia – are well below it.1
The same holds around the globe. For some reason, Swedish children have a much greater chance of being diagnosed as autistic than children in any other country. A 1997 epidemiological survey on the west coast of Sweden found a prevalence rate of 46.4 in 10,000, but the following year, across the well-traveled border with Norway, a survey using the same ICD-10 diagnostic criteria found a prevalence rate of only 5.2 in 10,000. One more year passed, and on the south coast of Sweden, only a short ferry ride from Denmark or Norway, an epidemiological survey using somewhat different diagnostic criteria found a rate of 72.6 in 10,000 (Fombonne 2003).2
Scant attention has been paid to these differences, for an obvious reason. While both sides in the debate about the autism epidemic play the numbers game with relish, ultimately they do not trust the numbers and at the slightest discrepancy are ready to sweep them aside. The underlying, scarcely articulated, article of faith they share is that at bottom the real rate of autism should not differ between states or countries, because it is determined by biological factors that, barring concentrations due to pollution or assortative mating, should be the same everywhere. This belief empowers them to dismiss the differences in numbers as artificial and temporary, merely reflecting the peculiarities of how each state (or country) defines autism, the effort and resources it dedicates to detecting it, or how deep epidemiologists have dug for it. In particular, researchers treat the U.S. Department of Education data, which we used in Table 1 above, as “not reliable for tracking autism prevalence,” essentially because the guidelines for educational assessment and administrative categorization differ a great deal between states. No wonder the rate of autism is very high in Oregon, since all that Oregonian children require to qualify as autistic for special education services is to demonstrate “impairments in social interaction” (Laidler 2005).
Table 1: Rates of Children ages 3 through 5 served under IDEA, disability category “autism” as a percentage of state populationa
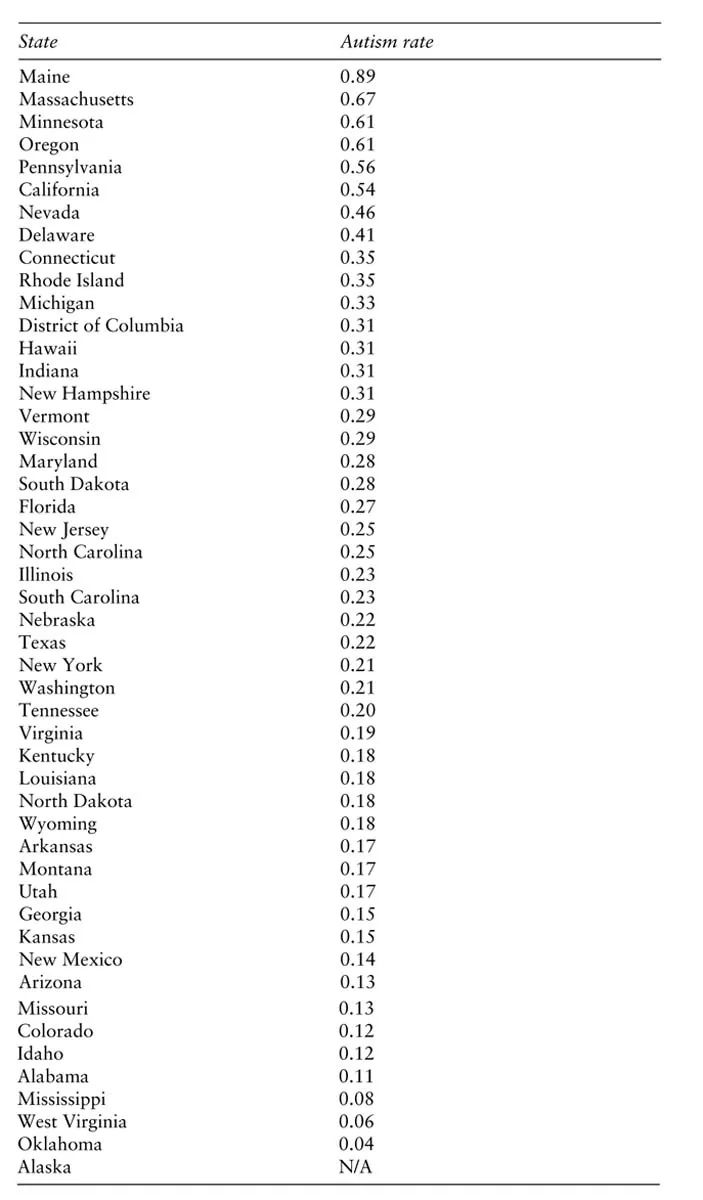
aThe number of disabled children divided by the total number of children 3 to 5 years old in the state’s population, and multiplied by 100.
The sociologist, however, need not assume that there is a single, real rate of autism everywhere underlying the different survey results, and therefore can pay more attention to what may be learned from these differences. We take the total population of actual autism diagnoses as our object. Unlike the epidemiologists, the scientists, and the activists on both sides of the debate, we do not treat these actual rates as merely imperfect reflections of some real though unknown and hence hypothetical rate, which must somehow be true everywhere. We do not consider the differences in diagnostic criteria, in awareness, in legislation, in the availability of services or the effort expended at detection, to be “artificial” factors masking the underlying natural reality. We are interested in identifying and explaining the looping processes that produce the actual population of autism diagnoses, and there is no better way of doing this than looking at factors that produce variation in this population.
There have been few efforts to date to explain state or international variation in the prevalence of autism. A promising start for the U.S. was made by Mandell and Palmer (2005), who found positive associations between state variance in the administrative prevalence of autism and the state’s education-related spending, the number of pediatricians in the state, and the number of school-based health centers (though the latter was not significant). This can be characterized as a “supply-side” argument. Where there are more spaces available because more dollars went into special education, more children with autism will appear to take these spaces;3 where there are more pediatricians and school health centers, this wider net of detection and screening would bring up more children with autism.
It’s a good start, because it shows that variation in the administrative prevalence of autism is neither random nor arbitrary. It is not simply a matter of how obscure bureaucrats at a state’s department of education chose to define autism, but varies systematically with certain variables that measure the effort of detection, or the relative probability of being diagnosed and serviced. We see problems, however, both with the logic of Mandell and Palmer’s argument, and with their results. The logic of the supply-side argument is ad hoc. Substitute for autism another developmental disorder – for example, learning disability – and the theory would predict the same result, despite the fact that variance in the administrative prevalence of learning disability is very different from autism. Only four of the seventeen states that are at or above the national mean in autism rates are also at or above the national mean in learning disabilities. Obviously, one would be entirely correct to argue that such a comparison is spurious because special education spaces, dollars, and other resources are finite and increases or decreases in one category are not independent of increases or decreases in another. This is, however, precisely the point, precisely why we said above that the supply-side argument is ad hoc. It is merely “glued” to the empirical case of autism, and one would require an additional and unrelated argument to explain why it is specifically autism that is increasing while other diagnoses are decreasing.
Mandell and Palmer’s results are elegant – each additional 1 million dollars spent increased the administrative prevalence of autism by 0.02 percent, each additional pediatrician was worth a 0.06 percent increase – but using an ad hoc logic of our own we can easily produce much better results. We invite the reader to re-examine Table 1. Is there something familiar about the distribution of states above and below the national mean? Of course there is! It is almost identical with the distinction between “red” and “blue” states (as you can see in Figure 2), at least as they divided during the 2004 presidential elections. The correlation is unbelievably neat. Of the 17 states above the national mean, a full 15 voted for the Democratic presidential candidate in 2004. Only 5 blue states were below the national mean, and none too far below it. The 22 states with the lowest administrative prevalence of autism were all red: they all voted for George W. Bush.4
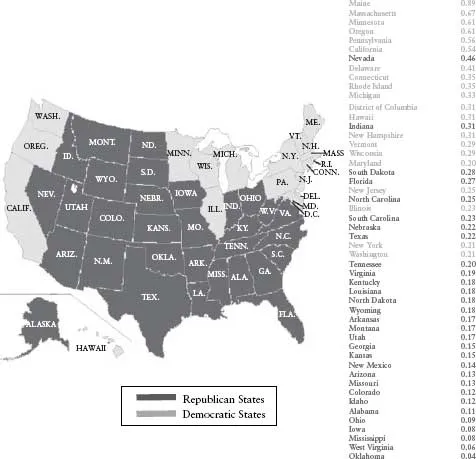
Figure 2: Red and Blue states (2004 elections) sorted by rates of children ages 3 through 5 served under IDEA, disability category “autism” as percentage of state population
Of course we do not mean to argue that a state’s political affiliation, whether it reliably polls Democratic or Republican, directly determines autism rates. The variable of political affiliation packs a lot of punch, to be sure, but it also packs a lot of different processes within it. It almost certainly stands for a whole package of supply-side factors such as a state’s GDP (reliably blue states are richer than reliably red states) and therefore the level of education-related spending, or the degree of urbanization (red states tend to be rural) and therefore the number of pediatricians and easily accessible diagnostic facilities. Almost certainly it stands also for demand-side factors such as the relative proportion of the highly educated in the population – blue states are more educated – which translates into more educated parents’ greater awareness and initiative in securing the diagnosis, such parents’ clout against special-education bureaucracies, or their tendency to form advocacy organizations.5 Finally, it measures something a little bit less tangible, such as a state’s political culture, the relative sensitivity of legislators to the rights of the disabled, their commitment to ideals of normalization and mainstreaming, or their electoral vulnerability to issues relating to early childhood education (Sigelman et al. 1981; Parish 2005). The distinction between “blue” and “red” is shorthand for an assemblage of social and political differences. It is instructive to see how neatly the administrative prevalence of autism varies with it. It certainly should give pause to those who argue that the rise in the number of autism diagnoses is caused by vaccines, or by environmental pollution, or by any other naturalist mechanism. We believe it is good evidence that “autism” is not simply a medical diagnostic label but also a charged political category. But to try to deduce an explanation from this finding would be completely ad hoc.
So let us lay the ground rules for what is to follow in the rest of this book. Any explanation for state variation in the administrative prevalence of autism must also be at the same time an explanation for the autism epidemic, which means it must answer two questions: “Why autism?” – that is, why is it specifically autism that is increasing and not learning disabilities or other disorders (something that supply-side arguments find difficult to do), and “Why now?” – since autism was named in 1943, why did it take 48 years for the number of diagnoses to begin to rise (something that demand-side arguments find difficult to do)?
Diagnostic substitution
Let us see how these ground rules work with what we believe is the strongest and most plausible account to date for the autism epidemic: the argument that it is driven by diagnostic substitution with mental retardation, that children who in the past would have been diagnosed as mentally retarded are now given the diagnosis of autism at increasing rates.
Two recent American studies provide strong evidence that diagnostic substitution has taken place and that it accounts for a significant portion of the rise in the number of autism diagnoses. First, Paul Shattuck (2006) used state data on special education enrollments – the same data we used in Table 1 and Figure 2 – to show that from 1994 to 2003, just as enrollments as either autistic or “developmentally delayed” increased across states, there was a corresponding decrease across states in special education enrollments as either mentally retarded or learning disabled. These were not two independent trends, but a single process of substitution. When Shattuck examined the two trends within each state there was a significant inverse correlation between the increase in the rate of autism enrollments and the decrease in mental retardation enrollments. Moreover, minus the rise of autism, there would have been no reason to assume that mental retardation and learning disability enrollments would decline. Before 1994, that is, before autism’s addition to IDEA legislation finally began to be implemented nationwide, the trend was of steady, albeit small increases in mental retardation and learning disability enrollments. Then in 1994 the curve turned downward. Shattuck interpreted his findings to indicate, albeit indirectly, that children who in the past would have been enrolled in special education as mentally retarded are now enrolled as autistic.
By no means is diagnostic substitution unique to the U.S. Numbers from the Israeli Ministry of Education paint a roughly similar picture. The proportion of children classified as autistic among all kindergartners with special needs increased from 7.6 percent in 2001 to 10.3 percent in 2008. There were even bigger increases in the proportion of children diagnosed with developmental delay and language delay, while the proportion of children diagnosed with mental retardation (of all degrees) and learning disability decreased from 16.3 percent to 9.4 percent, and from 8.3 percent to 1.3 percent respectively.6
Why would there also be a decrease in enrollments of learning disabilities associated with the rise of autism diagnoses? Earlier studies (MacMillan and Speece 1999; Macmillan et al. 1996) have shown that from 1976 to 1992, learning disabilities enrollments in the U.S. increased in association with decreases in mild mental retardation enrollments; that is, there was an earlier diagnostic substitution between the two. This makes it possible to speculate that the contemporary decrease in learning disabilities enrollments is, at bottom, also a form of diagnostic substitution from mental retardation to autism, albeit one that went through the circuitous route of learning disabilities, during a long period in which they were a more “popular” diagnosis.
Why would there also be significant increases in the diagnosis of “developmental delay”? This is an even more recent category. It was added to IDEA in 1997, and can be applied only to children between three to nine years of age. Thus it is a temporary designation, a placeholder. This diagnosis is a polite way of saying that mental retardation or autism or some other problem is suspected, but that the suspicion is not going to govern the assignment or treatment of the child, because it’s too early to call. As we argued in the introduction, there are strong connections between the diagnosis of autism and the designation of a child as “developmentally delayed,” as both categories encode the same kind of move away from the image of a fixed and global mental retardation. To the extent that autism, or the autism spectrum, is not really a thing but a domain of intervention composed of similarly structured objects of discourse, “developmental delay” no doubt is an integral part of this domain. One may add to it also the diagnosis of “language delay” or “language disorders,” since in the Israeli case, at least, they have experienced marked increase over time along with autism and developmental delay, but only among kindergartners, since after age six the same children tend to be switched to the category of “learning disabled” or to more specific diagnoses.
Shattuck’s evidence (or the evidence we gleaned from the reports of the Israel Ministry of Education) is indirect. He looks at global population trends and infers information about individuals. Using data from the California Department of Developmental Services on the actual diagnostic career of children from 1991 to 2004, Peter Bearman and Marissa King (2009; see also King 2008) were able to provide direct evidence of a rapidly rising rate of diagnostic substitution from mental retardation to autism in this state. They estimate that about a quarter of the rise in the autism caseload was due to this diagnostic substitution. A Canadian study, incidentally, reached a similar conclusion, estimating that diagnostic substitution from mental retardation accounts for a third of the increase in autism prevalence in British Columbia (Coo et al. 2007). There are good reasons, however, to assume that these are underestimates. Bearman and King use the known cases of actual diagnostic substitution, in children who were six or older by 1992, to estimate the probability that children born later and given the diagnosis of autism only would have been diagnosed as mentally retarded if there were no change in diagnostic criteria. Yet this assumes that the probability of getting a diagnosis of autism rather than mental retardation at age six is the same as at age two or three. This assumption is clearly untenable. Everything we know about how autism is diagnosed leads us to predict that the probability of being diagnosed as autistic rather than retarded decreases with age. There is also substantial evidence that the modal age of diagnosis has been going down significantly over the last two decades (Yeargin-Allsopp et al. 2003, 54; Fombonne 2003; Hertz-Picciotto and Delwiche 2009). This would lead one to estimate that diagnostic substitution from mental retardation accounts for a great deal more than a quarter or even a third of the increase in the autism caseload.
Yet it is probably the case that diagnostic substitution from mental retardation is only one pathway by which diagnostic change leads to increases in the number of autism diagnoses. As was evident in the much earlier “epidemic” of learning disabilities, there usually are several different pathways into a newly popular diagnosis (Ong-Dean 2005; 2006). One pathway leads from mental retardation presumably into the “low-functioning” pole of the autism spectrum, as it did with learning disabilities in the past; another pathway leads from “borderline” cases that may have been undiagnosed in the past, or from less severe disorders, like “specific developmental language disorder” (Bishop et al. 2008), into the “high-functioning” pole of the spectrum.
Supply-side and demand-side explanations for diagnostic substitution
Demonstrating the occurrence of diagnostic substitution, however, is hardly the final...
Table of contents
- Cover
- Halftitle
- Title
- Copyright
- Content
- Acknowledgement
- Introduction
- Chapter 1: THE PUZZLE OF VARIATION IN AUTISM RATES
- Chapter 2:THE FEEBLEMINDED
- Chapter 3:THE SURVEILLANCE OF CHILDHOOD
- Chapter 4: DEINSTITUTIONALIZATION
- Chapter 5: “AN EXISTENCE AS CLOSE TO THE NORMAL AS POSSIBLE”: NORMALIZATION
- Chapter 6: CHILDHOOD SCHIZOPHRENIA
- Chapter 7: THE RISE OF THE THERAPIES
- Chapter 8: BERNARD RIMLAND AND THE FORMATION OF NSAC
- Chapter 9: THE ATYPICAL CHILDREN
- Chapter 10: ASPERGER AND NEURODIVERSITY
- Chapter 11: THE SPACE OF AUTISM THERAPIES AND THE MAKING AND REMAKING OF THE SPECTRUM
- Conclusion
- Notes
- References
- Index
Frequently asked questions
Yes, you can cancel anytime from the Subscription tab in your account settings on the Perlego website. Your subscription will stay active until the end of your current billing period. Learn how to cancel your subscription
No, books cannot be downloaded as external files, such as PDFs, for use outside of Perlego. However, you can download books within the Perlego app for offline reading on mobile or tablet. Learn how to download books offline
Perlego offers two plans: Essential and Complete
- Essential is ideal for learners and professionals who enjoy exploring a wide range of subjects. Access the Essential Library with 800,000+ trusted titles and best-sellers across business, personal growth, and the humanities. Includes unlimited reading time and Standard Read Aloud voice.
- Complete: Perfect for advanced learners and researchers needing full, unrestricted access. Unlock 1.5M+ books across hundreds of subjects, including academic and specialized titles. The Complete Plan also includes advanced features like Premium Read Aloud and Research Assistant.
We are an online textbook subscription service, where you can get access to an entire online library for less than the price of a single book per month. With over 1.5 million books across 990+ topics, we’ve got you covered! Learn about our mission
Look out for the read-aloud symbol on your next book to see if you can listen to it. The read-aloud tool reads text aloud for you, highlighting the text as it is being read. You can pause it, speed it up and slow it down. Learn more about Read Aloud
Yes! You can use the Perlego app on both iOS and Android devices to read anytime, anywhere — even offline. Perfect for commutes or when you’re on the go.
Please note we cannot support devices running on iOS 13 and Android 7 or earlier. Learn more about using the app
Please note we cannot support devices running on iOS 13 and Android 7 or earlier. Learn more about using the app
Yes, you can access The Autism Matrix by Gil Eyal,Gil Eyal in PDF and/or ePUB format, as well as other popular books in Ciencias sociales & Sociología. We have over 1.5 million books available in our catalogue for you to explore.