NONE
eBook - ePub
Global Financial Stability Report, October 2019 : Lower for Longer
- English
- ePUB (mobile friendly)
- Available on iOS & Android
eBook - ePub
Global Financial Stability Report, October 2019 : Lower for Longer
About this book
Trusted by 375,005 students
Access to over 1.5 million titles for a fair monthly price.
Study more efficiently using our study tools.
Information
Publisher
INTERNATIONAL MONETARY FUNDeBook ISBN
9781498324021
Year
2019Chapter 1 Global Financial Stability Overview
Lower for Longer
Financial markets have been buffeted by the twists and turns of trade disputes amid growing investor concerns about downside risks to the economic outlook. Financial conditions have eased further since the previous Global Financial Stability Report (GFSR) but appear to be premised on expectations of additional monetary policy accommodation across the globe. Large declines in interest rates have created further incentives for investors to search for yield, leading to stretched valuations in some asset markets. Although accommodative conditions have helped contain near-term downside risks to global growth, they have also fueled a further buildup of financial vulnerabilities. Against this backdrop, medium-term risks to global growth and financial stability continue to be firmly skewed to the downside. Policymakers urgently need to take action to tackle financial vulnerabilities that could exacerbate the next economic downturn.
The Combination of Trade Tensions and Dovish Monetary Policy Has Led to Significant Swings in Financial Markets
The global economy remains at a difficult juncture, as discussed in the October 2019 World Economic Outlook (WEO). Growth has slowed, and inflation has continued to be muted across a number of economies. Trade tensions have persisted, despite the occasional temporary respite, with further rounds of tariffs announced since the previous GFSR.
Global financial markets have ebbed and flowed between periods of trade tension, where risk asset prices have fallen, and temporary truces, where asset prices have rallied. Equity prices of firms most exposed to trade tensions (including the automobile, metals, technology and telecommunications, and transportation sectors) have fared worse than their peers (Figure 1.1, panel 1). Other risk asset markets have moved in lock-step with equities. Credit spreads for lower-rated issuers have been relatively more sensitive to shifts in investor risk appetite (Figure 1.1, panel 2). Option-implied market volatility—which reflects investors’ expectations of future variability in markets—has swung between short-lived spikes and longer periods of relative calm (Figure 1.1, panel 3). Some of the price moves in August may have been amplified by relatively strained market liquidity conditions.1
Figure 1.1. Financial Market Developments
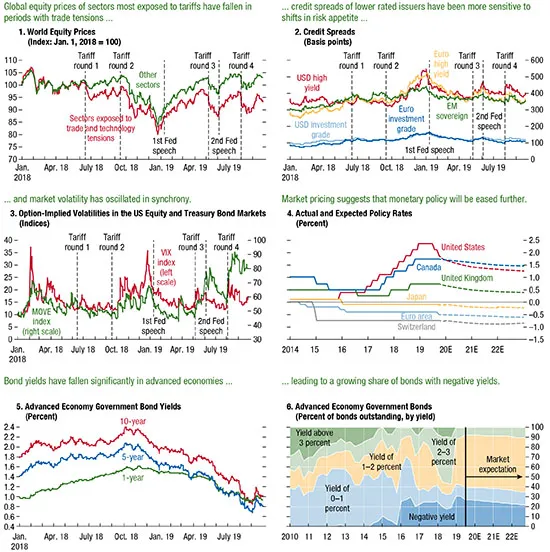
Sources: Bloomberg Finance L.P.; and IMF staff calculations.
Note: In panels 1–3, the four rounds of tariffs were in June and September 2018 and in May and August 2019. The first Federal Reserve (Fed) speech was by Chairman Jerome Powell on January 4, 2019 at the American Economic Association and the second was on June 4, 2019 at the Federal Reserve Bank of Chicago. In panel 1, “Sectors exposed to trade and technology tensions” comprises automobiles and components, metals and mining, technology and telecommunications (communications equipment, semiconductors, and telecommunications services), and transportation (air freight, containers and packaging, marine transport, and trading companies and distributors). “Other sectors” comprises all other sectors in the MSCI World Equity Index. Panel 5 shows government bond yields (from advanced economies deemed to have systemically important financial sectors, with available data) weighted by the current amount of government debt outstanding. Bond yields from the same countries are used to draw panel 6. E = estimated; EM = emerging market; MOVE = Merrill Option Volatility Estimate; USD = US dollar; VIX = Chicago Board Options Exchange Volatility Index.
Against the backdrop of weakening economic activity and business sentiment, increased downside risks to growth, and continued subdued inflation, central banks across the globe have adopted a more dovish stance. The US Federal Reserve cut its policy rate twice (in July and September) by a total of 50 basis points, the first rate cuts since the financial crisis, and ended the reduction of its securities holdings earlier than previously planned. The European Central Bank lowered the interest rate on its deposit facility by 10 basis points in September and will restart net purchases of assets in November.2 Many other central banks have adopted a more accommodative stance since the previous GFSR, and there has been a policy easing in economies representing about 70 percent of world GDP. Current and anticipated monetary policy accommodation has substantially boosted risk assets (Figure 1.1, panel 1).
This change in policy stance appears to have been interpreted by financial markets as a turning point in the monetary policy cycle, following a period of rate normalization in some economies. The shift suggests that a sustained normalization of rates and central bank balance sheets may be more difficult than previously envisioned, especially in the context of weaker global growth and when other central banks continue to pursue quantitative easing.
In response to recent central bank actions and communications, investors have reassessed the expected monetary policy path. Market pricing points to an additional 45 basis points of policy easing in the United States by the end of 2020 and suggests that policy rates could remain negative in the euro area, Japan, and Switzerland for many years (Figure 1.1, panel 4).
This reassessment of the outlook for monetary policy, along with concerns about the economic outlook and subdued inflation prospects, has led to a sharp decline in market interest rates across the globe. Average 10-year government bond yields in large advanced economies (weighted by sovereign debt outstanding) have fallen by about 75 basis points since the previous GFSR, despite the bounce back from August lows (Figure 1.1, panel 5). Yield curves have also fattened substantially, and in some cases have inverted, with the difference between 10-year, five-year, and one-year yields narrowing dramatically. The amount of bonds with negative yields has increased to about $15 trillion, including more than $7 trillion in government bonds from large advanced economies, or 30 percent of the outstanding stock (Figure 1.1, panel 6). Ten-year yields are now negative in a range of countries, including Austria, Belgium, Denmark, Finland, France, Germany, Japan, the Netherlands, Sweden, and Switzerland. Market pricing indicates that about 20 percent of sovereign bonds will have a negative yield until at least 2022.
Asset Valuations Remain Stretched
Declines in interest rates have further motivated investors to search for yield by increasing duration and credit exposures, a development that has boosted asset valuations.3 Ten-year term premiums in major markets are now highly compressed, and in some cases below levels justified by fundamentals (Figure 1.2, panel 1). In several countries this misalignment in term premiums has increased since the previous GFSR.
Figure 1.2. Asset Valuations
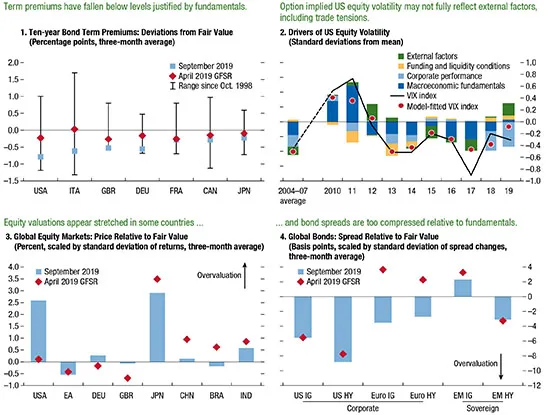
Sources: Bank for International Settlements; Bloomberg Finance L.P.; Consensus Economics; Federal Reserve Board; Fitch; Haver Analytics; IMF, World Economic Outlook database; Institute of International Finance; Philadelphia Federal Reserve Survey of Professional Forecasters; Standard & Poor’s; S&P Capital IQ; Thomson Reuters I/B/E/S; and IMF staff calculations.
Note: Panel 1 shows 10-year government bond term premium estimates, based on the Adrian, Crump, and Moench (2013) model, relative to the value implied by fundamentals in a number of models. See Box 1.2 in Chapter 1 of the April 2018 GFSR for more information. Panel 2 shows the drivers of equity volatility taken from a model of the VIX index that uses quarterly data from 2004:Q1 to 2019:Q2. Panel 3 shows the percent deviation of equity prices relative to a fair-value model, scaled by the standard deviation of monthly price changes. Panel 4 shows global bond spreads relative to a fair value model, in basis points, scaled by the standard deviation of monthly changes in spreads over three years. Panels 3 and 4 are scaled by standard deviation to aid comparison across economies where the underlying volatility in asset prices may differ. See Section 1 of Online Annex 1.1 for details of the asset valuation models. Data labels in panels 1 and 3 use International Organization for Standardization (ISO) country codes. EA = euro area; EM = emerging market; GFSR = Global Financial Stability Report; HY = high-yield; IG = investment-grade; VIX = Chicago Board Options Exchange Volatility Index.
Despite occasional spikes, implied volatility has been relatively contained on average this year. An IMF staff fair-value model points to corporate earnings and payouts as a key factor compressing US equity volatility (Figure 1.2, panel 2). However, the model also suggests that the current level of volatility may not fully account for external factors, such as trade tensions and uncertainty about the global economic outlook.
This divergence could in part result from investors’ belief that central banks will respond quickly to a sharp tightening in financial conditions, hence implicitly providing insurance against significant declines in stock prices. This highlights the communication challenges that central banks face when easing monetary policy to support an economic expansion in an environment of increased downside risks.
Other risk assets are also showing signs of stretched valuations.4 Equity markets appear to be overvalued in Japan and the United States (Figure 1.2, panel 3, shows misalignments scaled by monthly price volatility). Since April, US equity prices have increased whereas fundamentals-based valuations have declined as higher uncertainty about future earnings outweighed the boost from an expected rebound in earnings and lower interest rates. Equity valuations in major eme...
Table of contents
- Cover Page
- Title Page
- Copyright Page
- Contents
- Assumptions and Conventions
- Further Information
- Preface
- Foreword
- Executive Summary
- IMF Executive Board Discussion Summary
- Chapter 1 Global Financial Stability Overview: Lower for Longer
- Box 1.1. Implications of the Recent Bank Interventions in China
- References
- Chapter 2 Global Corporate Vulnerabilities: Riskier Business
- References
- Chapter 3 Institutional Investors: Falling Rates, Rising Risks
- Box 3.1. Are Fixed-Income Funds Well Prepared to Meet Investor Redemptions?
- References
- Chapter 4 Emerging and Frontier Markets: Mind the Debt
- References
- Chapter 5 Banks’ Dollar Funding: A Source of Financial Vulnerability
- References
- Chapter 6 Sustainable Finance: Looking Farther
- References
- Table 1.1. Macroprudential Policy Tools
- Figure 2.1. Corporate Performance and Outlook
- Figure 2.2. Funding Conditions and Debt Accumulation
- Figure 3.1. Institutional Investors’ Increased Risk-Taking in a Persistently Low-Interest-Rate Environment
- Figure 4.1. Portfolio Flows to Emerging and Frontier Markets
- Figure 5.1. Trends in US Dollar Activities of Non-US Banks
- Figure 6.1. Taxonomy of Environmental, Social, and Governance Issues and Relevant Stakeholders and Initiatives
- Footnotes