1
NO PROGRESS
Thirty years ago, Prime Minister Margaret Thatcher gave a speech to the UN which summarised the science as it was then understood and highlighted the need for global action to address the great ‘new’ climate change problem.[1] This speech is about as green as it gets for a politician. Although a great deal of subsequent research has refined that science and our understanding of the immense and subtle complexity of our climate, the main planks of the analysis were already in place back then, and they have remained remarkably robust ever since. The greenhouse effect is a bit of nineteenth-century science. The increase in greenhouse gases was already documented, and the step from increases in emissions to high temperatures was a simple and obvious one to make. By 1990, nobody could reasonably claim that they did not understand what climate change was and why it mattered. The failure to act has flown in the face of the knowledge of what that failure will mean for future generations.
The UN decided that immediate action needed to be taken on the reasonable grounds that there was enough evidence to act, and delay was only going to make things worse. There followed the ground-breaking UN Framework Convention on ClimateChange(UNFCCC),[2] signed in 1992, committing the signatories to action and drawing on the reports of the already established Intergovernmental Panel on Climate Change (IPCC). This in turn led to the Kyoto Protocol of 1997 and the Paris Agreement in 2015, with targets indexed back to the baseline of 1990.[3]
Apart from nuclear arms treaties, there has probably never been anything like the UNFCCC in human history. Hopes were high. The fact that the Soviet Union had imploded added to the sense that there was a new world order, capable of tackling this new and huge problem. The politicians declared a new dawn and promised to act. They have been promising ever since.
What was entirely absent from these groundbreaking global commitments was any sense of what was actually about to happen. The sobering truth is that, since 1990, the world has witnessed the golden age not of renewables but of fossil fuels, the environmental disaster that has accompanied (and been significantly caused by) China’s rapid economic expansion on a scale never previously seen in economic history, and a relentless increase in the carbon concentrations in the atmosphere. It is very hard to detect any positive benefits which have followed the adoption of the UNFCCC, and, as we shall see, some of the subsequent UN-driven institutional architecture, such as Kyoto and Paris, may actually have made things worse.
What has happened since 1990?
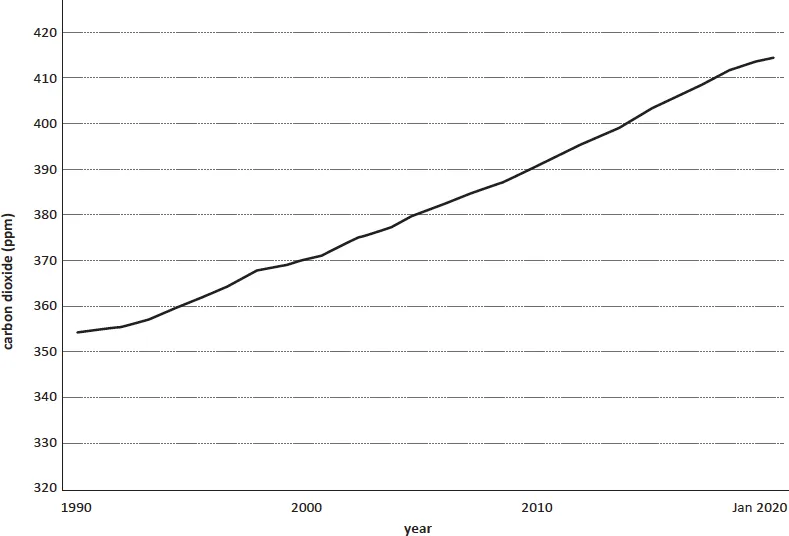
The first and most important fact, which cannot be repeated often enough, is that global emissions are still going up (but for the Covid-19 temporary lockdowns) as they have been since 1990. The result is that the concentration of CO2 in the atmosphere is now well past 400 ppm, having increased from around 355 ppm in 1990, and from about 275 ppm before the Industrial Revolution.[4] This is evident in the charts below, which should be deployed on the wall of every politician’s office.
The key thing to note about the first chart (Figure 1) is that not only are emissions still going up, but it is roughly a linear trend, and there are no blips in this trend. The great negative economic shock, the global financial crisis in 2007/08, does not even register. Nor do the effects of the Covid-19 pandemic.[6]
Figure 1 Global CO2 atmospheric concentration: global monthly mean concentration of CO2 (ppm)[5]
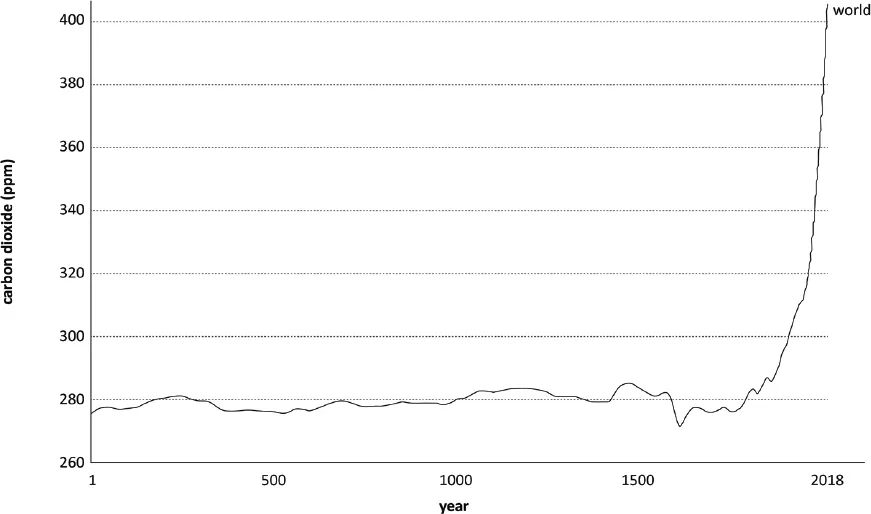
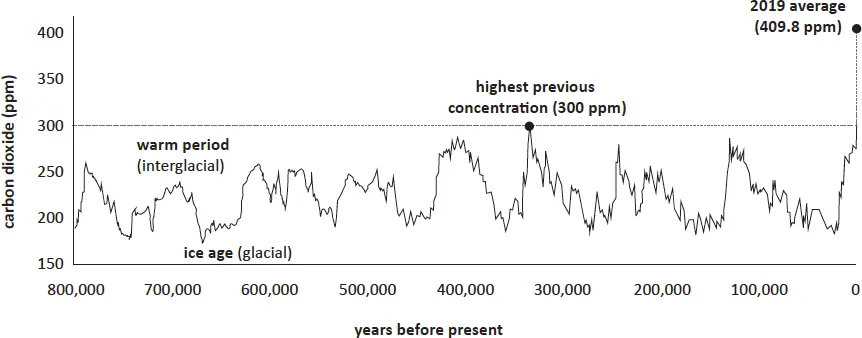
The 50 ppm increase in CO2 since 1990 is around 60 per cent of the 75 ppm total increase since the Industrial Revolution (see Figure 2). The difference between the pre- and post-Industrial Revolution emissions is clear in the second chart. Just how ‘special’ the last 30 years have been can be seen by looking at the longer-term growth in CO2 in the atmosphere, as illustrated in Figure 3.
There are three main reasons why emissions are still going up: burning ever more fossil fuels; the irrelevance of renewables so far; and the destruction of the natural environment’s ability to sequestrate carbon.
Figure 2 Global CO2 atmospheric concentration: global average long-term concentration of CO2 (ppm)[7]
The golden age of the fossil fuels
The last 30 years have provided for a perfect fossil fuel combination: burgeoning demand, notably from China; the coming of gas and new technologies (notably shale); and the absence of any effective climate change policies. It could not have been much better from the perspective of the fossil fuel industries; from the climate perspective it could hardly have been worse.
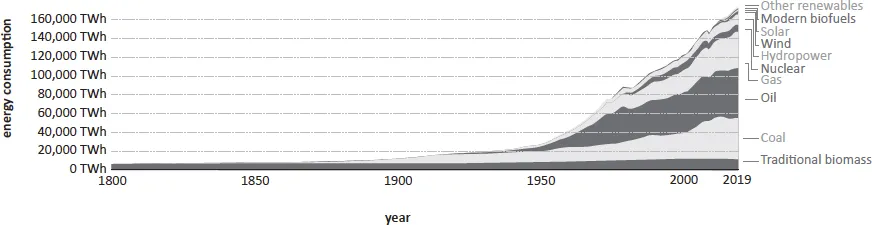
The demand for each of the fossil fuels depends on its final market – and that is ultimately you and me. As illustrated in Figure 4, up until 1990 it was all about oil and coal. Gas was illegal to burn in power stations in the US and Europe until 1990, so it is very much a post-1990 fuel.
Oil is used for transport and petrochemicals. For all the talk of electric vehicles, almost all of the world’s cars and trucks still use internal combustion engines, and, of these, diesel vehicles have seen the fastest growth. The growth of China has boosted the demand for cars, boosted world trade, and with it the shipping that has been using the dirtiest and cheapest oil, resulting in considerable sulphur and carbon pollution. Aviation has boomed too.
Figure 3 CO2 during ice ages and warm periods for the past 800,000 years[8]
Figure 4 Global primary energy consumption,[9] measured in terawatt-hours (TWh) per year. Here ‘other renewables’ are renewable technologies not including solar, wind, hydropower, modern biofuels and traditional biomass.
To put all this in perspective, since 1990 the world has added 100 million vehicles to the existing fleet of 1.2 billion, of which 30 million were produced in China.[10] The number of aircraft has doubled roughly every 15 years from around 5,000 in 1990 to 26,000. The volume of seaborne trade has risen from 4 billion tonnes in 1990 to over 10 billion tonnes now and accounts for 90 per cent of trade. Much of this huge growth has been container shipping, with an increase from 234 million tonnes in 1990 to 1,834 million tonnes in 2017.[11] This great transport growth has served to provide you and me with more car journeys, more deliveries to supermarkets and our homes, more flights for all those holidays, and all the goods that we buy that are packed into containers. We learned to appreciate just how much during the Covid-19 pandemic. Almost all of this transport growth has been facilitated by oil.
Oil’s other main use is in petrochemicals. This shows up in the plastics and a host of other products we have come to rely on. Plastics have been in the news because they have become ubiquitous pollutants of our oceans and shores. They litter our streets and landscapes. Microplastics are everywhere – in your house, in your food, in your water – and they pollute every river, lake, seashore, and all the oceans, and can even be found in deep ocean trenches. You might naively believe you can go ‘plastic-free’, but that would simply reflect an ignorance of just how far our lives have become plastic-dependent. They are even inside you.
Petrochemical demand has grown strongly, especially in China. Petrochemicals are the main driver for the projected pre-pandemic increase in oil demand of around 10 million barrels per day (mbd) through to 2030, overtaking transport.[12] Demand will return to 100 mbd post-pandemic, and this oil-burn is obviously incompatible with the 2°C target. None of this is compatible with the 2°C target. It all fits into the continued growth of carbon concentrations in the atmosphere, extending the pattern since 1990.
Oil does not have the petrochemical market to itself. Gas has been making big inroads as its sheer abundance becomes apparent. It no longer needs to be treated as a premium fuel to be reserved for the higher-value petrochemicals it helps to produce. There is so much gas that its supply is best treated as effectively infinite, and it too is in its golden age. Gas also provides a good energy vector for heating and, increasingly, industrial processes. Your house is probably gas-heated, and you may cook with it too. Much of your electricity is now generated by gas-fired power stations. From 1990, gas became the fuel of choice for power generation in both the US and Europe, as the old reliance on coal gave way, and as nuclear stalled. In 1990 the typical electricity system in the US and Europe was around 80 per cent coal and 20 per cent nuclear. It is now much more likely to be 40 per cent gas and significantly less than 40 per cent coal. The closure of nuclear, through both ageing and anti-nuclear policies, has also made room for gas.
The switch to gas from coal for power generation reduces carbon emissions significantly – by around 20 and 40 per cent compared with oil and coal, respectively. The joker in the pack is methane and methane leakage, most of which comes from badly maintained pipelines and from leaking conventional and fracked wells. Methane leakage is troublesome because it is a very potent greenhouse gas – up to 80 times worse than CO2 over 20 years,[13] although it does not stay in the atmosphere very long (and methane emissions from agriculture are more significant than those from natural gas).
Lots more coal since 1990
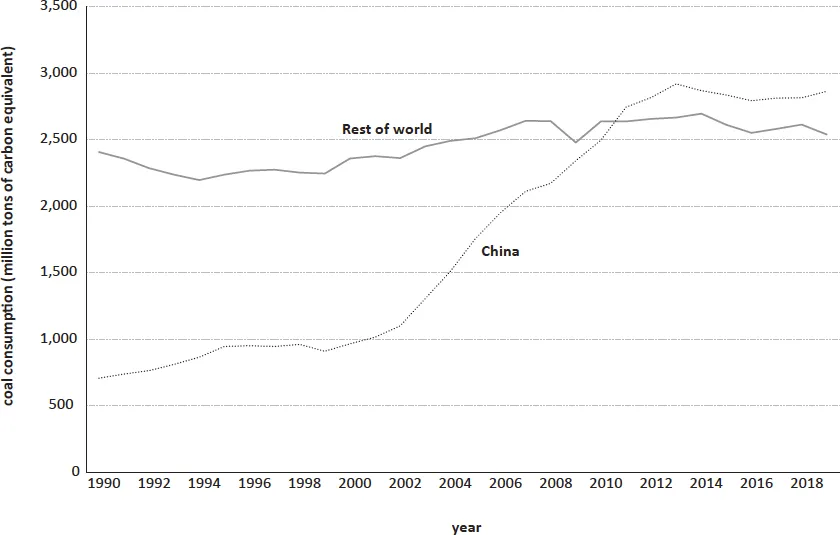
Coal is truly dreadful stuff. The story of coal since 1990 is remarkable, with its starring role in boosting carbon emissions. Chinese economic growth was (and still is) powered by coal, and this translates across to the growth of carbon emissions globally. In the 1990s growth in coal demand was rapid, but then began to level off at around 40 per cent of the world’s primary energy. The chart below illustrates how coal consumption in China accelerated and ultimately exceeded that of the rest of the world.
Under any serious interpretation of the ambitions to address climate change, reducing coal should (and would) have been the primary achievement in the last 30 years. While there have been some notable successes, these are largely lost in the noise, with the exception of the coal-to-gas switch in the US. The much-heralded UK squeeze on the coal industry, a rare example of successful carbon pricing, is just the flotsam of global coal-burn and therefore coal emissions. It takes only a few weeks for the world to replicate the entire coal generation capacity in the UK of a few years ago, and for most of the period from 1990 to now, the coal-burn held up in the UK anyway. The benefits of individual countries unilaterally closing coal come from the reductions of other pollutants (especially particulate matter PM 2.5 and its serious impacts on air quality), particularly close to cities, and to trees (notably sulphur and acid rain).
Figure 5 Coal demand in China and the rest of the world[14]
Figure 6 Coal production[15]
It is true that there are widely respected forecasts that coal’s days are numbered, and from an environmental perspective this would be good news. But what is presented as a reduction in the share of coal in the energy mix is not the same as a reduction in coal burnt. The International Energy Agency (IEA) forecasts that, globally, coal will fall from around 38 per cent to 25 per cent by 2040 if all ‘new policies’ (those currently announced) are fully implemented.[16] Reflect, however, on how much higher global GDP will be by 2040 on current growth rates and as the world’s economies recover from Covid-19. As noted, China, India and Africa may be three to four times bigger. Twenty-five per cent of a number four times bigger is a big increase, not a decrease, in the coal-burn, and all that coal burnt over the next 30 years will add to the carbon already up in the atmosphere. It is the coal burnt since the Industrial Revolution plus the coal-burn over the past 30 years, plus what is coming, and all of this in the atmosphere for more than 100 years to come. Peak coal may still be a long way off and, as with oil, levelling off is still a disastrous outcome.[17]
Corporate responsibility
Imagine you are the chief executive of an oil, gas or coal company. Imagine looking at these numbers. What you see is a large and, in most cases, growing market over the next 20–30 years. You look at all the fossil fuel projects that cross your desk. You do the analysis. Perhaps you take a pessimistic view about medium-term future fossil fuel prices, given the sheer abundance of the resources available, which make a nonsense of all those peak oil and peak gas forecasts that were peddled by politicians and analysts up until the price collapsed in 2014 and then again in 2020.[18]
You will be able to balance some of the possible price falls with cost reductions as technology keeps marching on, and every bit as fast as for the competing renewables. Every day the understanding of the earth’s crust deepens, and every day the drilling and extracting technologies improve. Soon you may have oil and gas platforms on the seabed available to you. The Arctic is being opened up by the Russians. What do you do? Do you say: ‘I should stop exploration, stop new investments and wind down my business’? Or do you say: ‘I should carry on and it is up to governments to impose a carbon price, regulate my company and take action’?
While some activists think you should do the former, their understanding of how global markets and boardrooms work is at best naive and partial. More than 90 per cent of these fossil fuels are produced by state-owned companies, and they are going to carry on. Why? Because their economies and their economic growth depend on them, and because they can. Think of Saudi Aramco and its centrality to the Saudi economy. Think of Russia’s Rosneft.
And that is what they are doing, just like the tobacco companies, the manufacturers of sugary drinks, arms manufacturers, construction companies that use cement and steel, farmers who use fertilisers and pesticides, and so on. Notwithstanding the enthusiasm for environmental and social governance and disinvestment from fossil fuel producers, every company in the FT100 index is embedded in the fossil fuel economy. Those who say that this is what is wrong with the ‘capitalist model’ need to consider just what would happen if we jumped off now, rather than over a sensible transition, and why there is no effective carbon price. The statist model is, from a carbon perspective, much worse. It is the work of Saudi Aramco and Rosneft. Climate activists attack European and US politicians and company executives. They don’t dare take on Vladimir Putin, Xi Jinping and Mohammad bin Salman. Gluing yourself to the HQ of Shell or BP is easy: doing it in Moscow, Beijing or Riyadh is much tougher.
The China factor
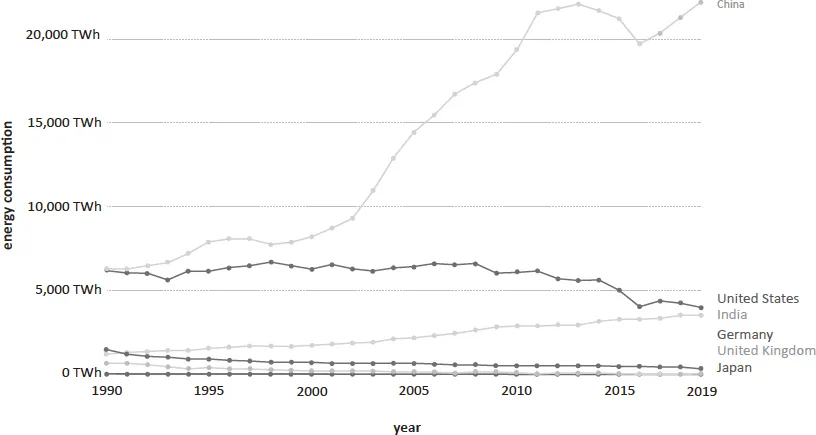
The growth of emissions since 1990 keeps coming back to China. The sheer scale of Chinese economic growth is unprecedented: nothing on this scale – or that of the environmental shock it has created – has ever happened before over such a short period of time. Only the Covid-19 outbreak has been able to make a serious dent, causing the economy to contract after decades of growth, and then only temporarily.
Think back to 1979. Most of the world’s attention was on the Iranian revolution and the oil shock it produced. Nobody gave much thought to the impoverished Chinese communist country oppressed since 1949 by Chairman Mao. The Great Leap Forward (1958–62) and the Cultural Revolution (1966–76) left around 70 million Chinese dead from famine and the intellectual class decimated. China was a poor country, insignificant except for its nuclear weapons and its challenge to Russia for communist leadership.
Few noticed too the changeover at the top. Deng Xiaoping, like the rest of the ageing leadership, was a hangover from the Mao regime, lucky to have survived being purged. His great opening of the Chinese economy took time to gather pace, and the fear of a loss of C...