![]()
1. Introduction
“All our knowledge has its origins in our perceptions."
—Leonardo da Vinci
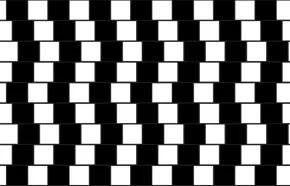
The ultimate purpose of computer graphics is to produce images and videos for human observers. Thus the success of any graphics application depends on how well it conveys relevant information to a human viewer. However, the inherent complexity of the physical world and limitations of computing hardware make it an impossible task to replicate the view of the real world. In fact, over 150 years of research on perception shows that no organism has a perceptual system that tries to create an exact representation of the real world. All perceptual systems, including the human perception system, make many assumptions in order to make sense of the real world. This can often lead to a gap between how we perceive the world and how it really is. Take for example the Café Wall illusion (Fig.1.1) where our perceptual system convinces us that the walls are not parallel when in fact they are. Given the vastly complex task of creating physically accurate imagery the best that graphics algorithms can aim for is to create perceptually accurate images. To achieve this goal it is essential to understand and analyse how the Human Visual System (HVS) perceives the world around it. This understanding will allow computer graphics practitioners to take advantage of the flexibility and robustness associated with human perception to decrease the gap between hardware performance and desired performance. In rendering, for example, resources can be allocated to areas of a scene that matter most to human observers, saving computation time. Similarly, visualization techniques have benefited from perceptual measures such as processing speed, which determines how quickly humans perceptually process features such as colour and texture. The integration of methods and techniques from perception research into graphics is particularly important if the goal is to create realistic imagery for movies, games, and immersive environments.
Figure 1.1.: The Café Wall illusion first discovered by Gregory and Heard deceives the human perceptual system that the lines are not parallel [GH79].
The study of perception is, however, a complicated task. The main difficulty is that it can not be directly measured or observed. Given this, the only way to study human visual perception is through indirect measures. Any perceptual process does, to a certain extent, influence human behaviour and it is through the study of this behaviour (covert or overt) that we can create models of perceptual systems.
One of the main methodologies used by perception researchers to study and understand hidden perceptual processes are psychophysical experiments [MBB12]. Psychophysics is the empirical study of the relationship between physical stimulus and the resulting perceptual or sensory responses [Ges13]. It was first introduced in Fechner’s Elements of Psychophysics which presents methods and theories for studying sensation [Fec48]. Psychophysical experiments are conducted in a highly controlled environment with an absolute control over as many factors as possible. Because of the desire for absolute control over the experiment, most psychophysical experiments use simple abstract stimuli. This makes it difficult to not only conduct these experiments but also to model the results.
Another technique typically used for perceptual research is the eye-tracker. Researchers have employed eye-trackers to investigate what kind of visual information people focus on while viewing images, videos, or visualizations. This can provide valuable information on which parts of the stimulus are important and on the order in which an image is scanned. These tools have become part of mainstream graphics research and have provided unique insights.
Brain imaging techniques are another class of measurement methodologies used for studying perception. Neuroimaging technologies allow researchers to visualize the processing of information in the brain directly. There are a number of safe imaging techniques in use throughout the world for research and medical purposes. Functional magnetic resonance (fMRI) works by detecting the changes in blood oxygenation that occur in response to neural activity. Technological advances in the acquisition of fMRI data and its processing have made it possible to analyse neural activity as quickly as the images are acquired allowing this data to be fed back to the subjects. It is then possible for subjects to voluntarily learn to modulate their own brain activity using real-time fMRI data (rtfMRI) [BHVH12]. Other signal acquisition techniques include magnetoencephalography (MEG) where brain activity is mapped by recording magnetic fields produced by electrical currents occurring naturally in the brain using very sensitive magnetometers. However, one of the most popular brain mapping techniques is Electroencephalography (EEG) which measures the electrical activity of large numbers of neurons close to the brain surface. EEG has been particularly important for sleep research and for detecting abnormalities in brain waves [RK87, FKH67, GAL90]. EEG has been used extensively in clinical psychiatry, brain-computer interface (BCI) research and perception due to its high temporal resolution, inexpensiveness and ease of use compared to the other imaging techniques.
Although psychophysical experiments and eye-trackers have been used extensively in graphics research, neuro-imaging methods have not yet been explored within a graphics context. Most neuro-imaging techniques have been used predominantly for medical diagnostic purposes, in perceptual psychology, and by the brain–computer interface (BCI) community to assist or augment human cognition and movement. Much of this research is conducted with few participants and often tested and applicable only in highly controlled environments. However, brain imaging and brain mapping techniques can serve as a bridge that link the digital representation of multimedia and the perception and comprehension of its content. In this thesis I extend the scope of EEG specifically to investigate the perception of visual output from computer graphics applications and create methods based on direct neural feedback for more realistic settings that are applicable for a variety of real-world problems. EEG is a particularly interesting modality for graphics research because it is non-invasive, relatively easy to use, and the cost of equipment is low.
This thesis theorizes that EEG is a viable modality for investigating highlevel perceptual problems in graphics. It presents an initial proof-of-concept for the use of EEG for the analysis of human visual perception for graphics problems. To demonstrate this theory I test the following hypotheses :
- Different image and video qualities will evoke a measurable neural response;
- The neural response to different image and video qualities can be classified with a single trial of EEG data;
- Neural responses to varying image and video qualities can be used in a feedback loop to optimize image/video parameters.
1.1. Thesis structure and contribution
Parts of this dissertation have been presented at various peer-reviewed conferences and journals including ACM CHI Conference on Human Factors in Computing System, Transactions on Applied Perception and IEEE Computer Graphics and Applications and have been published in the according conference proceedings [MLM12] and journals [MGM12, MM14]. The basis of this dissertation is founded on these publications but combines them in the unifying concept of creating an interdisciplinary field that integrates brain imaging with computer graphics applications and discusses the opportunities and challenges in this field.
After a short introduction and overview of the necessary background in Chapter 2 I examine the problems in graphics that can be improved by a better understanding of how the human perceptual system works. In Chapter 3 we investigate the perception of different rendering artifacts appearing in videos. My work shows that it is possible to use EEG data to see the distinct differences in the perception of different artifacts occurring in rendered videos and images. Chapter 4 proposes a new methodology to classify single trial EEG data based on the artifact seen by the user. In Chapter 5 we explore the possibility of using a neural feedback loop to optimize image and video parameters to enhance the perception of the videos and images for each individual user.
I conclude in the last part with some thoughts and discussions about the achieved results, draw a conclusion and give an outlook on future work and already published work by others that build on the results of this thesis.
![]()
2. Prerequisites
2.1. EEG Basics
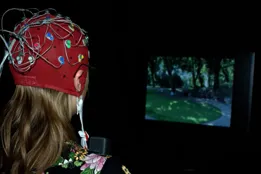
EEG measures the electrical activity of a large number of neurons close to the brain surface. Traditional EEG systems require anywhere from 32 to 64 electrodes to be fitted to the head of a participant at specific locations (Fig 2.1). This is usually achieved with a cap of attached electrode positions that is pulled over the head. To ensure conductivity between the electrodes and the scalp, contact gel needs to be applied to the electrodes which is a time-consuming and messy procedure.
Figure 2.1.: Participant performing an EEG experiment
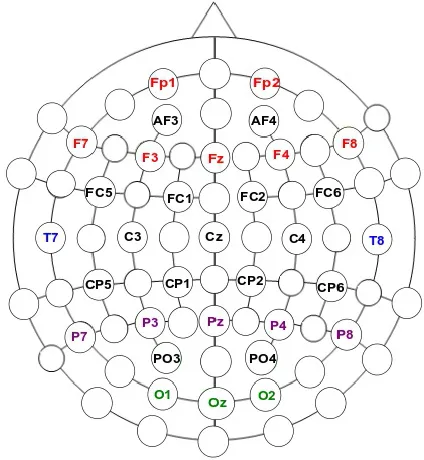
Fig. 2.2 shows the electrode placement in the traditional 10-20 electrode system for 32 electrodes. This system is based on the relationship between the location of an electrode and the underlying area of cerebral cortex. Each electrode placement has a letter to identify the lobe and a number to identify the hemisphere location. The letters F, C, P and O are for frontal, central, parietal, and occipital lobes. Even numbers (2,4,6,8) refer to electrode positions on the right hemisphere, while odd numbers (1,3,5,7) refer to those on the left hemisphere. Each scalp electrode is located near certain brain centers, roughly. F7 is located near centers for rational activities, Fz near intentional and motivational centers, F8 close to sources of emotional impulses. Electrode positions C3, C4, and Cz deal with sensory and motor functions. Locations near P3, P4, and Pz contribute to activity of perception and differentiation. Primary visual areas are below locations O1 and O2. However, these are rough estimations and may not reflect the particular areas of cortex accurately, as the exact location of the active sources is still an open problem due to limitations caused by the non-homogeneous properties of the skull and different orientation of the cortex sources.
EEG signals from electrodes must be amplified before they can be converted to digital form and stored. They also need to be filtered to remove artifacts from amplification and sampling. Another type of artifact to be considered and removed originates from eye blinks and facial muscle movements.
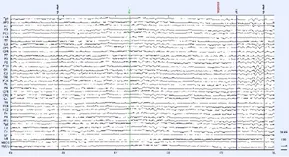
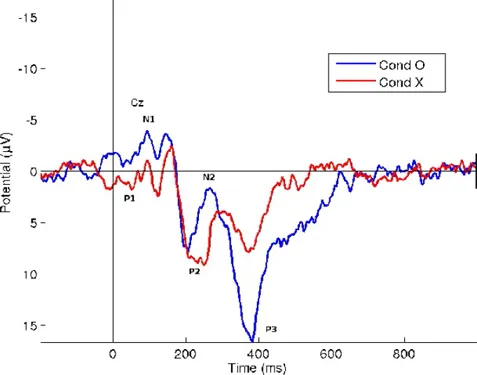
Typically, the brain’s response to a stimulus is analyzed using event-related potentials (ERP) which measure the response to sudden changes in stimuli. Given that EEG data reflects many concurrent neural processes, the response to a single event is not directly visible in the recording of a single trial, Fig.2.3(a). Many identical trials must be conducted to average out any non-related brain activity in order to make the ERP waveform visible, Fig. 2.3(b). Averaging is done by extracting the segment of EEG surrounding the stimulus from each trial and electrode and lining them up with respect to the start of the stimulus (Fig. 2.3(a)) [Luc05]. An ERP waveform can be time-locked to any externally observable event referenced to the onset of the stimulus. The resulting ERP’s consist of positive and negative voltage deflections which allow us to visualize cognitive processing during a trial. In Fig. 2.3(b), the peaks and troughs are labelled P1, N1, P2, N2 and P3. The initial P1 component occurs regardless of the type of stimulus and is just the response to any visual stimulus. The N1 component is the matching process whenever a stimulus is presented, it is matched with previously experienced stimuli. In contrast, the P3 wave, which occurs approximately 300ms after stimulus onset, depends on the task being performed and the visual stimulus presented [Luc05]. It is hypothesized that the P3 component, which has been a major component of research, reflects the speed of stimulus classification resulting from discrimination of one event from another. Shorter latencies indicate superior mental performance relative to longer latencies. This can be seen from Fig. 2.3(b) which is the response to an oddball experiment where the participants were shown sequences consisting of 80 percent Xs and 20 percent Os and were asked to press one button for X and another for O. Since the frequency of O was much less, the P3 component response is much higher than for X.
Figure 2.2.: Electrode positions and labels in the 10-20 system with 32-electrodes in a BioSemi cap [bio13]. Each electrode corresponds to a specific underlying brain regions.
(a) Labelled EEG data over time from a single trial: Each curve corresponds to one electrode.
(b) Averaged curve of many trials for one electrode.
Figure 2.3.: Raw EEG data shows no distinct peaks in response to stimulus occurrence (vertical lines in a). By averaging many identical trials, time-locked to the onset of the stimulus, the Event Related Potential (ERP) becomes visible.
One reason why ERPs have particularly been used for perception and attention research has been the temporal resolution of EEG measurements which allows measuring brain activity from one millisecond to the next. Also given the nature of electrical activity there is no measurable delay between brain activity generated inside the head and the potentials recorded from the scalp. This makes EEG a particularly useful tool for studying time-critical, temporally resolved, real-time brain responses to sensory input.
Recently, researchers have also experimented with using EEG for graphics problems based on ERP measurements [LM11, LWM11]. Unfortunately, the ERP method is time-consuming and it requires many participants and many trials per participant. Recent advances in EEG research have overcome this impediment by creating methods for the analysis and classification of singletrial data [PBSDS06, MGPF99, RMGP00]. In the following, we explore the current work in applying EEG to graphics and the future of EEG as a viable modality for graphics research. To record the EEG data, we use a BioSemi ActiveTwo system [bio13] with 32 electrodes placed on the scalp according to the International 10-20 system. The sampling rate is 256 Hz at 24-bit digitization resolution. In addition, the horizontal and vertical electroocculograms (EOG) and the EEG at both mastoids are recorded. The mastoids were used to remove any data with muscle movements or eye blinks. This setup is used for all the experiments presented in this thesis.
2.2. EEG and Graphics
Until recently, the use of EEG outside specialized fields wa...