An Atlas of Northamptonshire presents an historical atlas of the greater part of Northamptonshire (the first quarter having been published as An Atlas of Rockingham Forest). It presents in map form the results of fieldwork and documentary research undertaken since the mid-1960s to map the landscape of the whole of Northamptonshire prior to enclosure by Parliamentary Act. This is the first time a whole county has been completely studied in this way, and the first time a whole county has had an accurate view of its medieval landscape with details of the medieval fields, woods, pastures and meadows which have been mapped by ground-survey of archaeological remains confirmed where possible from aerial photographs and early maps. It is also the first time a county has been mapped showing all pre-parliamentary enclosure providing comprehensive data for the difficult theme of early enclosure in a midland county. Complete relevant historic map sources are listed, many in private possession and not lodged with county record offices. Settlements are discussed based on the detailed mapping of every house depicted on historic maps as wells the extent of earthworks, which provides much new evidence relative to settlement development in the Midlands. As well as being highly relevant for anyone studying medieval settlements and enclosure, it illustrates how GIS can be used to present a very large amount of historical and landscape data for any region. The clearly laid out maps in full colour throughout contain an immense amount of data which together provide a fascinating new portrait of this historic county.
eBook - ePub
An Atlas of Northamptonshire
The Medieval and Early-Modern Landscape
- 280 pages
- English
- ePUB (mobile friendly)
- Available on iOS & Android
eBook - ePub
An Atlas of Northamptonshire
The Medieval and Early-Modern Landscape
About this book
Trusted by 375,005 students
Access to over 1.5 million titles for a fair monthly price.
Study more efficiently using our study tools.
Information
Subtopic
ArchaeologyIndex
Social Sciences1 INTRODUCTION
The present volume complements the Rockingham Forest Atlas published in 2009.1 It covers the remaining 1,999 square kilometres (772 square miles) of the historic county of Northamptonshire, which includes the Soke of Peterborough (see Figure 2 and Key Maps). The two volumes present in map and essay form the results of fieldwork and documentary research undertaken since the mid-1960s to map the landscape of the whole of Northamptonshire prior to enclosure by parliamentary act. The methodology of integration and analysis of the data in digital form, using a Geographical Information System (GIS), was developed by the authors in the 1990s in work for Northamptonshire County Council.
The county
A discussion of the topography and geology of the Rockingham area has been given in the previous atlas.2 A brief outline is given here for the remainder of the county but it is not intended to give a full discussion as it is given in Williamson et al. 2012.3
Northamptonshire is dominated by the valley of the river Nene, which flows eastward, passing through the fen into the North Sea. The Welland, which also flows east through the fen, forms much of the northern boundary of the county. In the southwest the county also encompasses a small part of the Ouse catchment, particularly that of its tributary the Tove (Figure 2).
The geological strata dip gently to the south-east. Extensive areas of the gently sloping plateau have been overlain with drift deposits of boulder clay. There are a large number of relatively thin geological strata including various clays, limestones and ironstones. The east, central and south-eastern areas of the county are dominated by a gently dipping boulder clay capped plateau which has been only relatively lightly dissected by the rivers and streams. Where these have cut down through the strata an often bewildering array of strata come close to the surface across relatively short distances as one moves up the valley sides. It is here that the permeable geology is normally found.
In a few areas, notably in the far south-west and north-east there are areas of limestone plateau. In the north-west of the county the plateau has been heavily dissected with relatively small areas of higher ground where the permeable geology is usually found, separated by wide vales which are largely of clays (Figure 3). On the very eastern edge the county encompasses a small section of the fen.
This broad pattern of relief and geology, the latter working principally through the soils, has been a dominant influence of land use and settlement across the county throughout its history.
Administrative units
Whilst physical geography was a significant influence underlying landscape character, the way in which the landscape was managed and organised could be equally influential. Detailed discussion of these influences upon particular places is given within the following chapters but a brief overview is given here.
County
The historic county of Northamptonshire included all the townships within the Soke of Peterborough and those of Little Bowden (now in Leicestershire), Stoneton (now in Warwickshire), Nethercote and Grimsbury (now in Oxfordshire) and parts of Thurning, Lutton and Luddington (now in Cambridgeshire). With the exception of Stoneton (for which no data was available) all the townships now within adjacent counties are included. The county boundary is based upon the township boundaries as given in the historic map sources. The exceptions are Thurning, Lutton and Luddington which are particularly complex as they lay in two counties and map sources give different boundaries at different dates. For example Thurning is shown on the Ordnance Surveyors’ Drawings (OSDs) of 1817 to be wholly in Huntingdonshire, the enclosure award and map of 1839 refer to it as being in both Huntingdonshire and Northamptonshire but the map does not mark the boundary, whilst the Ordnance Survey (OS) First Edition 1:10,560 scale mapping from the 1880s puts it in both with the boundary dissecting the village. However, it is possible that the later boundary from the 1880s is an enclosure imposition. Similarly at Lutton and Luddington none of the maps mark the county boundary, though the enclosure map for Luddington refers to the parish as being in both Northamptonshire and Huntingdonshire ‘or one of them’.4 The boundary for all three has therefore been taken from the OSDs with reference to all other maps (Figure 4).
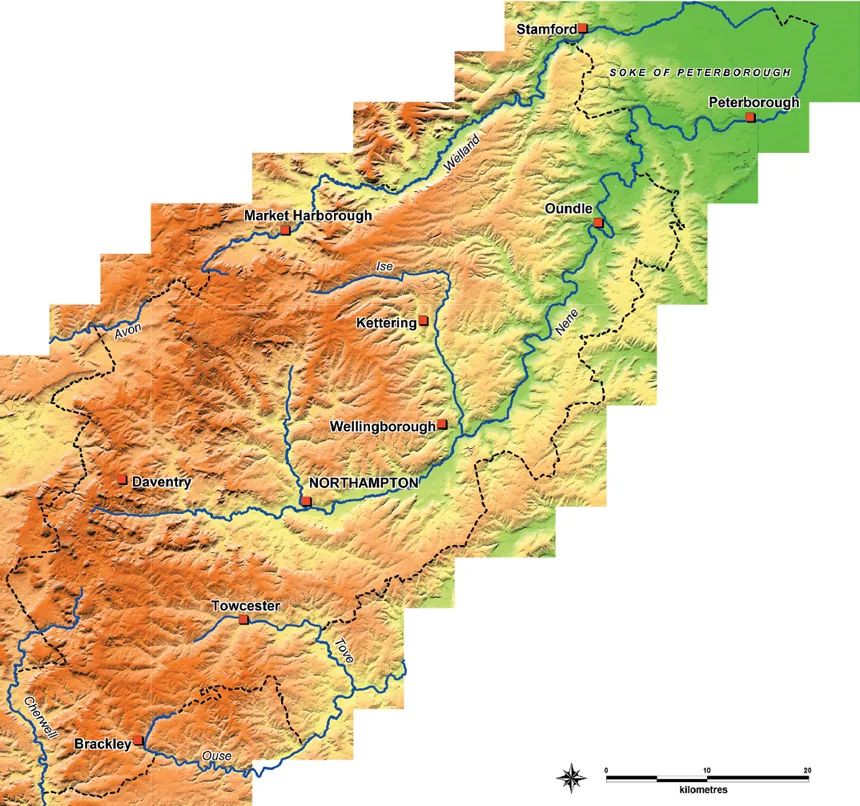
Figure 2. Northamptonshire relief, rivers and major towns. (Crown Copyright, Ordnance Survey licence no. 100026873).
Other anomalies occur around Whittlewood and Salcey forests. It is known that both forests crossed the county boundary and data has been mapped to the extent shown on the 1608 map at Whittlewood and the 1826 enclosure map at Salcey, with a small area of additional data taken from the OSD of 1814 to complete Salcey Green.5 For this section of the county boundary all the forest and relevant township maps were consulted and it was determined that the OSDs were the most accurate that pre-dated enclosure and thus have been used.
The county was divided up into smaller administrative units of hundreds (Figure 5), and townships. Parishes were at this date (pre-1880) ecclesiastical units and, although in Northamptonshire the parish and township were often the same unit of land, the parish did not influence the way the landscape was organised and managed, and they are not discussed here. Data were collected and analysed by the most influential administrative unit, the township.
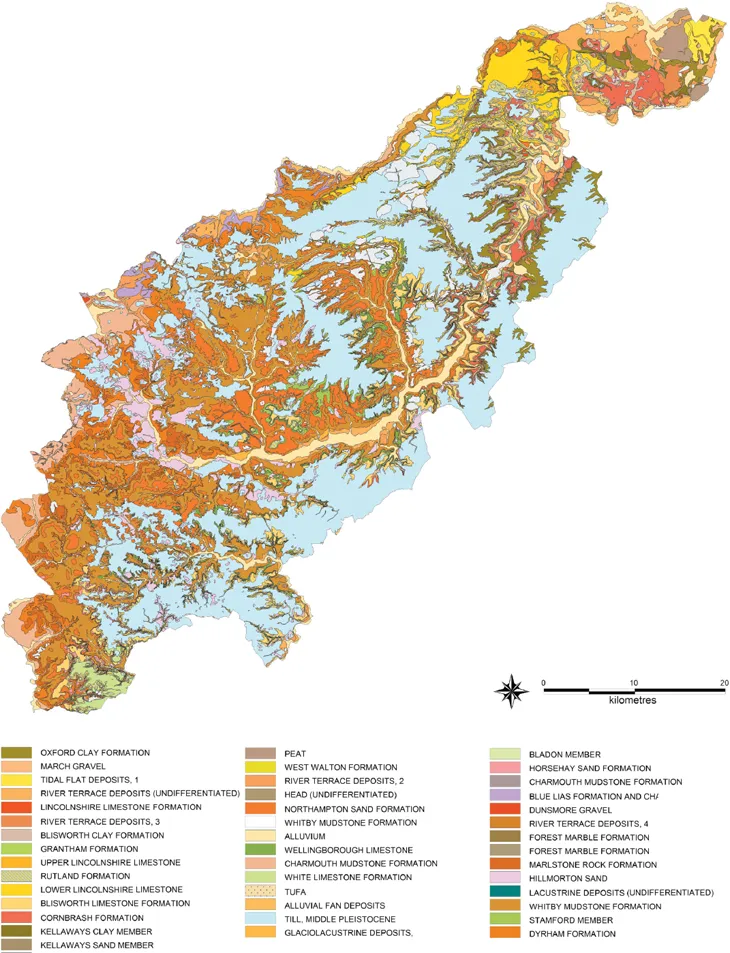
Figure 3. Northamptonshire geology.
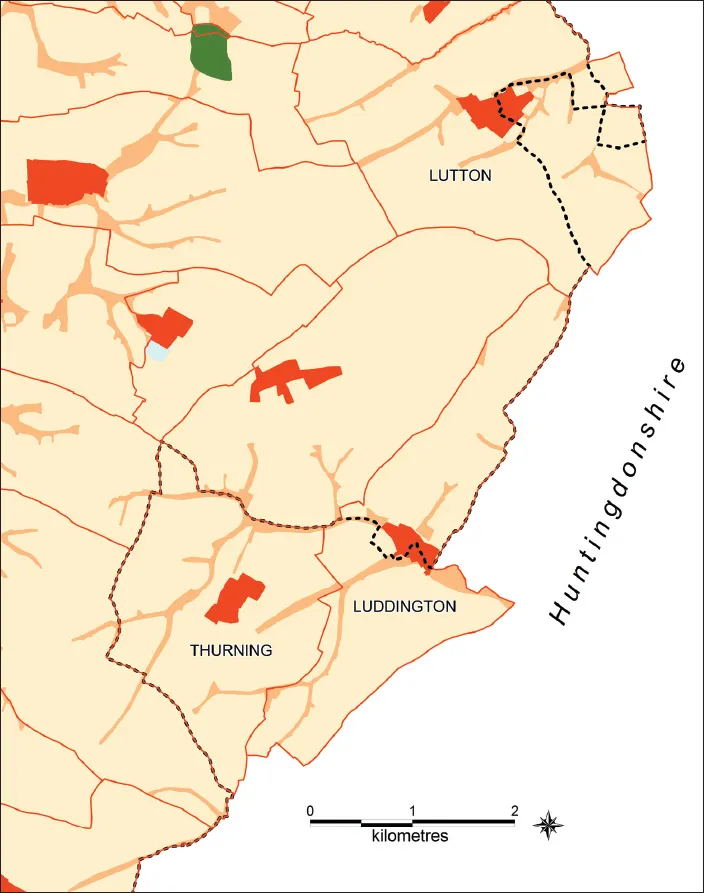
Figure 4. The pre-modern county boundary is shown as a dotted black line with the township boundaries in red. Thurning was in both Northamptonshire and Huntingdonshire but no map shows the boundary. Lutton and Luddington can be seen to lie in both counties with the boundary dissecting the villages.
Township
Townships were the primary unit of administration, within which communities and their resources were organised from the medieval period to the late 19th century, when they were reorganised into civil parishes. The township also forms the basic unit by which most of the earlier written sources for the landscape are organised and was normally the unit within which enclosure took place (see Chapter 4). They appear to have been formed to allow each community to have a balanced range of resources. In some instances they have detached blocks of land, often meadow or wood, which may be the result of manorial links or the division of earlier estates. Some township boundaries are known to be ancient and follow the same course as Saxon charter boundaries as at Oundle, Kettering and Badby.6
The range of resources within, or accessible to, each township were typically arable, pasture, meadow and woodland. The type and amount of each resource was highly influenced by the location of the township and its administrative structure. Those located adjacent to the Nene or Welland had a greater proportion of grass in the form of rich alluvial meadows than those in the ‘champion’ regions in the heart of the county. Similarly those within the forest perambulations had access to pasture within the woodland which, though highly regulated and linked to particular tenures, gave access to additional resources than those available to the champion townships (see Figure 1 and below).
It is likely that prior to the formation and fixing of township boundaries that some resources, particularly grazing, were shared among multiple townships. Figure 6 shows the location and extent of heath that it has been possible to plot, as well as heath related names. Where the location of the heath is known it can be seen to be on the periphery of the townships. The small blocks within each township represent the allocation of a once shared resource. For most places the date such divisions were made is not known but for others they are recorded and mapped as at Pipewell in 1518 (see ‘estate maps’ below). At Easton on the Hill part of the heath is shared with Wittering and allocations to each place are only made when Wittering is enclosed in 1759. An undated map of c.1780 marks the closes that now occupy the shared area as ‘intercommoned farm’.7
The data in Figure 6 are presented with the early-modern heath underneath that of the medieval. Some of the medieval heath had gone by the early-modern. Conversely that shown as additional to the medieval is a reversion to heath on the poorer lands, notably still on the township periphery, but was not originally heath. Some had been part of the open field arable whilst other was woodland (see atlas pages 3 and 7 for examples).
Methodology
The open fields, woodland, settlement, communications and administrative organisation of the county in the medieval and early-modern periods have been mapped in so far as our data allowed. In the essays that precede the atlas proper the patterns revealed in the data have been related to the physical geography, comprising relief, drainage and geology. Geological information has been used here as a proxy for soil types, which have yet to be mapped at a high resolution for the county.
The GIS data have been created in two stages. Work on the Rockingham Forest area, comprising the northern quarter of the modern county, was undertaken in 2006–7 on behalf of the Rockingham Forest Trust, in a project managed for them by Stuart Storey-Taylor and funded mainly by a grant from the Heritage Lottery Fund. Digital data for the remainder of the historic county were created in 2007–10 on behalf of the University of East Anglia, in a project managed by Tom Williamson and funded by a grant from the Arts and Humanities Research Council. The digital data created in both projects are available to view and will be available for download online by the Archaeology Data Service (ADS) following publication of the present volume.8
There are many potential ways of presenting and analysing the information acquired. The approach in the present work, together with the Rockingham Atlas is to publish detailed maps at the 1:25,000 scale for the whole county, so that the principal evidence is available in an accessible format that can be used in the future for a variety of research purposes. Both volumes are accompanied by an introduction that explains the geographical and historical context of Northamptonshire, including chapters that deal with key aspects of landscape development. In preparing this introduction we have also drawn upon the large quantity of historical information which has been assembled by the authors over many years. The introduction to this volume presents an interpretation of the results of all this research as we currently see them.
Tom Williamson and his co-authors have approached the GIS data in a different way, discussing primarily the development of the landscape at a county level without the detail of parish by parish maps. While one of us has contributed on enclosure in both volumes, for some other topics the present volume presents an interpretation different from that given by Williamson. The two volumes both use GIS generated maps based on the same source data, while a draft on settlement which used some of the data and ideas presented here was provided to Williamson when he was compiling his volume in 2009. In all other respects the interpretations presented in the two volumes are quite independent. Doubtless other workers will make re-assessments in the future, drawing upon the published maps and GIS data and these are to be welcomed.
In this volume, chapters attributed to individual authors are indicated within the text. Chapter 2 Forests and Woodland and Chapter 3 Open Fields, by David Hall; Chapter 4 Enclosure by Tracey Partida, Chapter 5 Rural Settlement by Glenn Foard.
Our digital mapping of the historic landscape for the whole county was created to a uniform standard, but for case studies additional information was collected in much greater detail. The Ordnance Survey (OS) 1st Edition 1:10560 scale maps of the 1880s, warped and registered in GIS, formed the base for all digital mapping of the early-modern landscape. The accuracy of digital mapping from manuscript map sources is dependent on the accuracy of the scanned Ordnance base-maps, as well as being influenced by the difficulties of transcription of estate, enclosure and other source maps that are typically planimetrically inaccurate. Whilst we have sought to register the 1880s maps as accurately as possible, a few have internal inconsistencies of scale, but an overall accuracy in the mapping of ±5 metres has been attempted. The OS 1880s mapping was chosen as the base because they provide the first systematic accurate large scale mapping for the whole county which in t...
Table of contents
- Cover
- Title Page
- Copyright
- Contents
- Acknowledgements
- List of Figures
- List of Tables
- Chapter 1: Introduction
- Chapter 2: Forests and Woodland
- Chapter 3: Open Fields
- Chapter 4: Enclosure
- Chapter 5: Rural Settlement
- Appendix 1: Map sources for township boundaries
- Appendix 2: Map sources for GIS data
- Notes
- Abbreviations
- Bibliography
- Index
- Atlas Maps
Frequently asked questions
Yes, you can cancel anytime from the Subscription tab in your account settings on the Perlego website. Your subscription will stay active until the end of your current billing period. Learn how to cancel your subscription
No, books cannot be downloaded as external files, such as PDFs, for use outside of Perlego. However, you can download books within the Perlego app for offline reading on mobile or tablet. Learn how to download books offline
Perlego offers two plans: Essential and Complete
- Essential is ideal for learners and professionals who enjoy exploring a wide range of subjects. Access the Essential Library with 800,000+ trusted titles and best-sellers across business, personal growth, and the humanities. Includes unlimited reading time and Standard Read Aloud voice.
- Complete: Perfect for advanced learners and researchers needing full, unrestricted access. Unlock 1.5M+ books across hundreds of subjects, including academic and specialized titles. The Complete Plan also includes advanced features like Premium Read Aloud and Research Assistant.
We are an online textbook subscription service, where you can get access to an entire online library for less than the price of a single book per month. With over 1.5 million books across 990+ topics, we’ve got you covered! Learn about our mission
Look out for the read-aloud symbol on your next book to see if you can listen to it. The read-aloud tool reads text aloud for you, highlighting the text as it is being read. You can pause it, speed it up and slow it down. Learn more about Read Aloud
Yes! You can use the Perlego app on both iOS and Android devices to read anytime, anywhere — even offline. Perfect for commutes or when you’re on the go.
Please note we cannot support devices running on iOS 13 and Android 7 or earlier. Learn more about using the app
Please note we cannot support devices running on iOS 13 and Android 7 or earlier. Learn more about using the app
Yes, you can access An Atlas of Northamptonshire by Tracey Partida, David Hall, Glenn Foard, David Hall, Glenn Foard in PDF and/or ePUB format, as well as other popular books in Social Sciences & Archaeology. We have over 1.5 million books available in our catalogue for you to explore.