![]()
1
Interpreting archaeological topography: lasers, 3D data, observation, visualisation and applications
Rachel S. Opitz and David C. Cowley
The central issues of this volume are introduced, describing laser scanning and 3D data for archaeology. Archaeological interpretations of topography and the skills sets required are discussed in the context of rapidly changing approaches and the need to integrate field experience and computer aided analysis. An outline for understanding and working with ALS ranges across issues of scale, certainty of interpretation, processing, visualisation and integration, concluding with thoughts on the impact of regional research traditions and prospects for the future.
Keywords: 3D data, ALS, experience, archaeological topography, scale, integration, research traditions
Preamble
Airborne Laser Scanning (ALS), or lidar (terms used interchangeably throughout this book), has been described as one of the most important innovations in data collection and interpretation for archaeology (Bewley et al. 2005), and it is the principle focus of the volume. However, the themes, approaches and methods discussed in this volume are broadly applicable to laser scanning, close-range photogrammetry and other 3D data collection methods in use in archaeology, and these too are included.
Laser scanning is a technology which accurately and repeatedly measures distance, based on a precise measurement of time, and combines these measurements into a collection of coordinates. These coordinates are normally stored as a point cloud, from which information on the morphology of the object being scanned may be derived. Photogrammetric approaches also produce 3D point clouds describing the shape of an object based on the triangulation of matched points from multiple images, and many of the applications and processes overlap with those discussed in this volume in the context of laser scanning. Objects recorded with these techniques can range from a small artefact recorded by a triangulation scanner in a laboratory, to vast extents of landscape totalling many 1000s of km2 recorded from an airborne platform. The scope of what may be recorded and studied through these techniques, from objects to surface structures to buried archaeology, traversing spatial scales, and the range of questions which may be approached, has led to their adoption across the archaeological community. These specialist techniques are now an integral part of many academic, popular and heritage management projects.
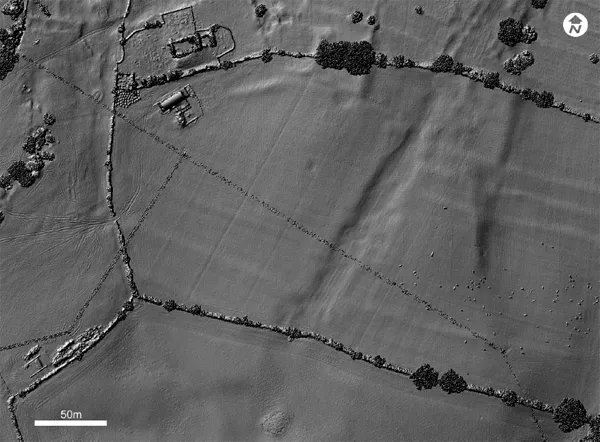
In particular, the last decade has seen an exponential growth in the use and awareness of ALS by archaeologists and cultural resource managers. The ‘magic’ of a new technology with the ground recorded in detail, the ability to ‘see through’ trees and the powerful images produced, all promised a brave new world. And so it is – a world of possibilities and challenges, both in ensuring appropriate, archaeologically reliable applications that inform us about the past, but also in developing practices that integrate the strengths of new possibilities in manipulation and interrogation of vast digital datasets with so-called ‘traditional’ skills of archaeological observation and interpretation (Figure 1.1).
Figure 1.1: A relief shaded digital surface model (DSM) generated from an extract of high resolution Flimap 400 lidar survey flown by helicopter at the deserted medieval settlement of Newtown Jerpoint, Co. Kilkenny, Ireland. Remarkably fine detail is present in the model, the result of a ground sampling distance for the survey of 15 cm. Centre left, tyre marks from vehicles can be seen converging at a break in the field boundary; returns from power lines can be seen running diagonally across the model; and towards the bottom right sheep can be seen grazing in the field. This image records features with minimal surface expression, for example rendering field surfaces in remarkable detail. However, these ephemeral landscape features are mixed in with textures that are a product of data collection and processing such as the slight ‘grain’ that runs from top to bottom across some areas. Interpreting such an image benefits from an ability to manipulate lighting (at the very least), an understanding of how it was created, and experience built on field observation. © The Discovery Programme/Heritage Council
This theme is at the core of this volume, by drawing on 10 years of archaeological engagement with ALS to explore the technical and interpretational challenges of this data, and to address the integration of approaches drawn from direct observation, data manipulation and visualisation, and to move beyond the purely technical or observational to engagements with past lives. The use of archaeological topography in the title of this volume identifies a focus on the topographic expressions of the past in the present, whether the earthworks (humps and bumps) of past settlements and field systems at landscape scale or the micro-topography of tool marks on an artefact. And it is this manifestation of past activities and processes in 3D, whether at micro- or macro-scale, that creates an exciting challenge in combining approaches from a wide variety of archaeological practice. To evoke an obvious generalisation, these approaches range from the muddy-booted fieldworker engrossed in the topography of a hillside to the computer geek sitting in a darkened room surrounded by humming hardware and writing complex software to create a virtual environment! Of course these are polar extremes, but they do highlight the importance of combining ‘field-craft’ and observation with the powerful algorithms and visualisation techniques that dense and/or extensive 3D data demand if we are to do anything more than scratch the surface. This volume draws together expert papers from across a broad spectrum of engagement with archaeological topography as expressions of developing practice in a rapidly evolving field.
This introductory essay provides some background and introduces the main themes of the volume. Principally these are the growing archaeological applications of 3D data, for which laser scanning is now a major source, and how these relate to the interpretation of topography. ALS is not straightforward ‘data’ and its incorporation into routine practice demands a level of understanding and critical thinking, which range across scale of analysis, certainty of interpretation, the roles of processing and visualisation, integration and varying uptake and regional traditions. The essay concludes with some comments on prospects for the future and a brief description of the contents and origins of this volume. The emphasis throughout is on the underlying principles, rather than technical descriptions or issues. For an overview of the technical aspects of laser scanning see Chapter 2 (Opitz) and attention is also drawn to the glossary of key technical terms on p. 266.
3D data in archaeology
Digital 3D data is now entirely embedded in archaeological recording, interpretation and visualisation, within a wide variety of projects and at a variety of scales. ALS has found applications in mapping and prospection surveys in woodland, scrub and open ground, and may provide the only means of survey in difficult to access areas. While basic mapping may draw on relatively low-resolution, usually second-hand, data, the potential of high point densities to provide incredibly detailed recording of small landscapes and individual sites has been demonstrated. ALS has shown its value in providing landscape context, drawing on geomorphological mapping of palaeo-features and landscape characterization, and informing conservation studies focused on the impacts of erosion or modern land use.
On the site scale, terrestrial laser scanners (TLS) are used to collect bespoke data for specific archaeological projects. Such projects may include recording a site or monument before excavation or conservation work takes place, detailed documentation during excavation of complex or easily damaged features, or scanning of highly eroded or abraded surfaces to highlight subtle features. Like ALS, this type of recording has immediate primary applications in erosion and stability monitoring, particularly of monuments exposed to weather, pollution and tourists. With even smaller scale scanners used in laboratories the same processes of documentation and applications apply in equal measure to small objects, and are increasingly part of the study of the manufacture and use of artefacts.
In all cases the integration of 3D data into archaeological practices promotes the use of ever more sophisticated modelling and visualisations, from the creation of virtual replicas for display in a physical or digital museum or dissemination over the internet, to virtual reality and immersive visualization projects. Throughout, while the primary aim of these products may be to communicate and engage with a wide audience, these approaches also have a vital role for the investigating archaeologist in supporting interpretation where the visualization and measurement of very small scale and subtle features is essential (e.g. tool marks or rock art), and to under-pin spatial analyses such as viewsheds and least cost-paths, and inclusion in interactive virtual reality models. Universally, it is the use of 3D data as an articulation of archaeological topography that lies at the heart of the processes.
Archaeological topography
Topographic survey, in the first instance the interpretation and survey of archaeological earthworks, is a long-established tradition with antiquarian origins (e.g. Bowden 1999). Early cartographers experimented with depictions of slopes, developing through military surveys depictive techniques like hachures and shading that were used to denote natural and anthropogenic earthworks. This approach has a rich history as an archaeological technique for documenting whole swathes of landscape, as a means to think through, understand, record and communicate sites like Iron Age earthworks, deserted medieval villages, and, on a grand scale, ancient Rome. Topographic surveys at a range of scales create coherence and aid in understanding the features surveyed, providing a plan view, but also attempting to convey something of the topography of the site/landscape. This latter aspect, of conveying topography, has varied in the degree to which conventions and depiction have successfully allowed the viewer to interpret slope, but is of course inherent in contours and other expressions of height differences such as shaded relief models. For archaeological survey the collection of 3D data was, less than 20 years ago, a time-consuming process, and while for map-making the innovation of photogrammetric pairs of aerial images was a major step-forward for quickly capturing the form of large areas, its uptake by archaeologists has been uneven.
The last ten years have witnessed an increase in pace and intensity in archaeological engagement with 3D data, ranging from data collection by total station and DGPS through the increasing use of terrestrial laser scanning and close range photogrammetry. In tandem, huge improvements in 3D modelling software are rapidly changing how topographic documentation is undertaken on excavations. While these developments encompass the full range of archaeological recording, from close detail in an excavation trench, or within a building, to extensive landscapes even at country-scale, these advances in 3D recording primarily impacted practice on the site to object scale and the links with archaeological topography in the traditional landscape sense were not emphasized.
This is the mix into which ALS has been added, greatly advancing the ability to collect and work with 3D models of large areas. The popularity of ALS for studying forested areas, floodplains and rural areas in general has renewed interest in the topic of topographic survey, and further spurred integration with digital technologies and applications. The potential of these synergies demands critical examination of working practices, especially in the area of generating archaeologically meaningful and stimulating interpretations of topography and in revitalizing the use of topographic data in landscape projects.
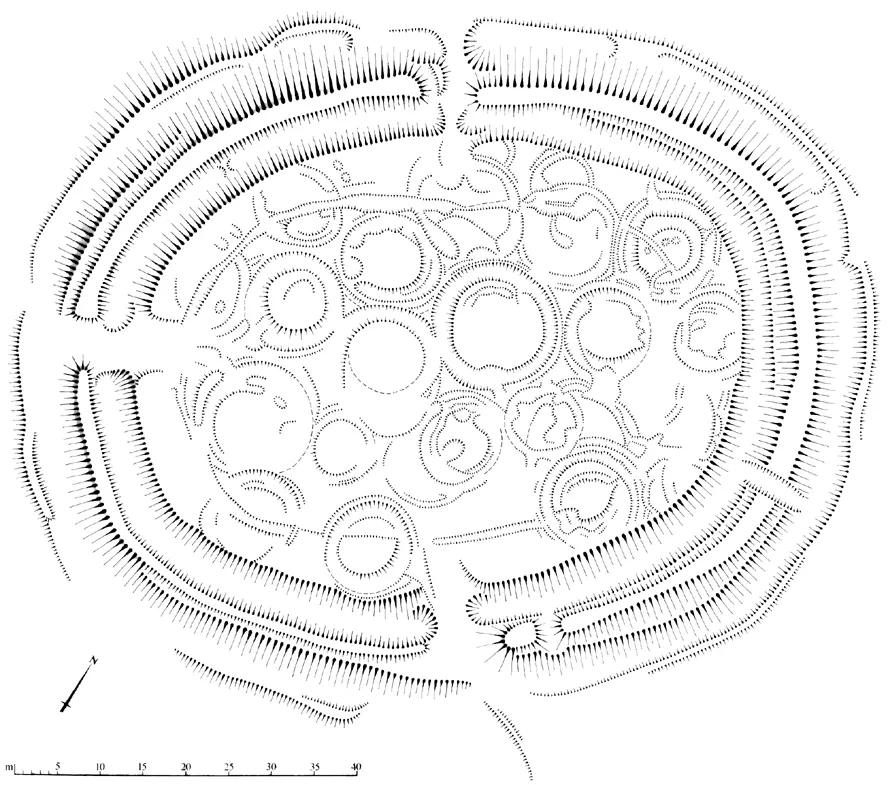
To illustrate our views on the intersection of 3D data and the practices of recording, visual depiction and interpretation a brief commentary on the use of hachures and shading in traditional approaches is instructive. These conventions have been used to depict slopes and as a means of recording and communicating the results of an analytical engagement with earthworks – What are the humps and bumps? How do they interrelate? How do they express structures from the past? and so on. Here, the processes of archaeological interpretation and depiction are intertwined. Thus, while the results of such analytical site survey should be metrically accurate, the depiction is a product of the interpretative engagement of the surveyor with the earthworks, and the translation of their interpretation into a drawing. This is a process that is heavily dependent on experience, a sound knowledge-base and a reflexive, self critical approach. The site of Braidwood in southern Scotland is a good example, where the subtle, incredibly complex earthworks are a product of a sequence of construction of timber round houses and palisaded and earthwork enclosures (Gannon 1999). The survey drawing (Figure 1.2) is a result of about three days in the field and an intense engagement with the humps and bumps of the site, what they might mean and how to translate that into a meaningful plan – undertaken by two highly experienced fieldworkers with many years of experience between them. This has produced a plan which expresses their observations and can be ‘read’ – a plan in which the observation and interpretation of the earthwork remains are explicit and completely intermeshed (Figure 1.3).
The plan of Braidwood makes an important point – that the interpretation of archaeological earthworks (or natural topography for that matter) is a skill built on experience and knowledge, where intuition and subjective judgements are very much to the fore. This may seem, at first glance, old-fashioned and irrelevant to the new reality of digital survey data, where height data has often replaced depictive survey and digital drawing packages have taken the place of the draughtsman’s pencil. However, while ALS is providing digital surface models at a scale and level of detail that would have been unimaginable 20 years ago, it also presents considerable methodological and interpretative challenges that relate to the nature of the dataset and how it is processed, manipulated and used to generate archaeological information. Many of these require new approaches rooted in processing algorithms and visualisation software and new skills in digital data manipulation to go along with them, but others take us back to the skill-set that produced the plan of Braidwood or that have been honed examining aerial photographs. We would argue that in engaging with digital 3D data the skills of reading the topography and the employment of experience and knowledge are still very much at the fore.
Figure 1.2: A masterful example of an earthwork survey at Braidwood in southern Scotland produced by Angela Gannon and Strat Halliday. The complex palimpsest of ephemeral earthworks has been examined in detail building an understanding that has been translated into an analytical drawing. This process is a complex interplay of fine-tuned observation, experience and drawing skills. © Angela Gannon, reproduced by kind permission
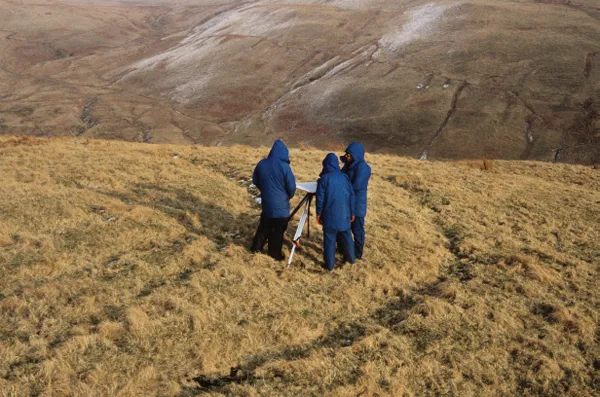
Figure 1.3: The slight earthworks on Gibbs Hill in southern Scotland are deciphered by a team and translated into an interpretative analytical drawing similar to Figure 1.2. The people are standing between two of the shallow trenches which once held timber palisades. © Strat Halliday, reproduced by kind permission
Understanding ALS
As archaeological use of ALS has developed it has become increasingly clear that it is not an ‘objective’ dataset that can be used uncritically. Indeed terrain models, like any models, are constructs and often riddled with unspoken assumptions. Firstly, the primary data collection and processing parameters have a major impact on output, while the ability to ‘see’ is heavily dependent on software for manipulation and visualisation, and data artefacts may be a trap for the unwary. These factors are a complex mix of objective parameters (e.g. point density) and subjective judgements (‘this visualisation looks better than that’) that are inextricable from the pervasive issue of archaeological interpretation. So, for all the new technology and software, the basic issues of how archaeological information are created remain central.
While fundamentally we see the use of ALS and other 3D digital data sources as a continuation of existing practices, the specifics of how we work with these technologies throw up some important differences of approach which impact on established survey practices and workflows. Firstly, the emphasis of much ALS work in archaeology has been desk-based, with limited engagement in concurrent or subsequent ground observation. A purely desk-based approach carries certain dangers – principally that there may be no or limited feedback between ground observation and ALS interpretation. Thus knowledge of the site types that may be expected in an area and artefacts created by modern landuse, for example, may not inform the desk-based work (processing – manipulation – visualisation – interpretation) as it should. Lack of this basic type of knowledge of a landscape is the main factor in the misinterpretation of aerial photographs (e.g. Wilson 2000) and the same will certainly be true for ALS. A related point concerns the interplay of manipulation, visualisation and interpretation, and at a basic level the role of archaeologist and ALS specialist – two roles which, in current practice, usually do not overlap much. Many ALS data are used by archaeologists who have little understanding of the processes by which it has been generated (e.g. a hillshade model), while ALS data may be processed with little or no consideration of archaeological imperatives (inevitable if ALS data is ‘second-hand’). Such divisions are not desirable and best practice projects have developed a synergy of these different skill-sets where the ability to manipulate data interacts with knowledge of the archaeological landscape.
Addressing scale and certainty
One of the major challenges for archaeological uses of ALS is how to work at an extensive scale, with potentially huge and complex datasets (this also applies to multi/hyper-spectral data (Beck 2011) and to datasets collected over smaller physical areas but with very high spatial or temporal detail). This problem is particularly relevant to areas without good archaeological databases that can support effective heritage management, where lidar may be a key (or the sole) source of new archaeological information and much depends on its interpretation. Archaeologists working in a research context may choose to study relatively small areas for which the lidar and other archaeological and supporting information can be inspected in detail. However, for cultural resource managers using lidar to help set planning priorities ahead of development across large areas, particularly where the overall archaeological record is poor or variable in coverage and quality, a strong dependence on lidar is problematic as a close inspection of all areas of the...