![]()
Part 1: In Principle
In Part 1, we introduce the basic concepts about data visualizations and why they are important. We explore origins, types, and considerations when designing data visualizations. We discuss where SAS can add value to the process of creating dashboards and data visualizations. You will see how to derive additional value from big data and better engage your audience.
![]()
Chapter 1: Data-Driven Journeys
Overview
This chapter sets the tone for what is to come in the book and includes some visual examples of data visualizations and what you can expect to create with SAS Viya yourself. Looking back in time, we will discuss how common terminology in data visualization, like the dashboard, came to be and introduce topics that we delve into further as the book continues.
Audience
This chapter is for all readers because it provides an introduction and origins of what is contained in this book on data visualization. No matter your experience is in SAS Viya, you will be shown some ideas to help explain what is to come.
“Every company has big data in its future, and every company will eventually be in the data business.”
Thomas H. Davenport
Introduction
Studies have shown that readers of newspapers skim the paper for headlines, images, and data visualizations to decide if they want to read the article. This skimming is heightened in a world of personalized newsfeeds across many channels and sources. This means that the dashboards of yesterday might not be equipped to meet the audience requirements of today. Learning from other information channels provides some great ideas for data visualization and dashboard design. As the quote from Davenport alludes, all companies will be leveraging big data and will be challenged to turn this into competitive advantage. Just remember that data visualizations are primarily designed to deliver this valuable information with clarity and simplicity… do yours?
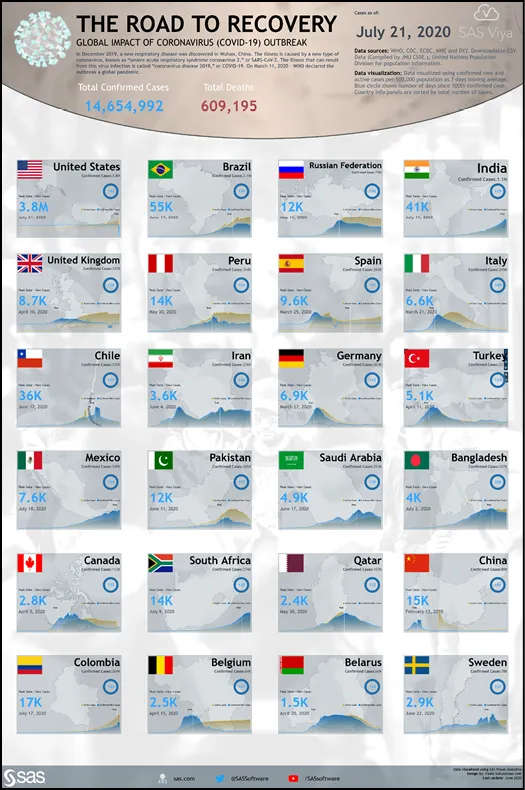
Creating modern dashboards and reports that can be shared and remembered by people is so important today. In Figure 1.1 you can see an example of sharing COVID-19 data in a poster format created using SAS Visual Analytics on SAS Viya. This book steps through many examples and tips to make your SAS Visual Analytics reports and dashboards grab your audience’s attention and deliver insight with your data visualizations.
Figure 1.1: SAS Visual Analytics example showing the global impact of coronavirus (COVID-19) outbreak for selected countries (Schulz 2020)
Attracting and retaining the attention of a modern-day audience is tougher than ever before. The rise of information volume and velocity has changed our lives in almost every way. We are in the information age, and we are “informavores” (Miller 1983).
INFORMAVORE:
Information + Vorare (Latin – to devour)
Originally used as a way of describing humans in the Information Age, being informavores has quickly become our new way of life. In the way that herbivores eat plants or carnivores eat meat, the informavore consumes information as the primary source of their diet. Today with social media and our digital life, information analysis is much harder than ever before. Using this simple analogy in the idea of a carnivore or omnivore, an informavore is simply a consumer of information. The question is whether your information is cutting through into the stream at all? With so many options today for information, if your data projects are not being consumed, people are filling the gap with other sources.
In short, as analysts, our information products are competing with a massive amount of information today, from social media, to niche websites, Reddit, news (fake included), microblogs, video blogs, and ever-changing sources that we rely on to live our modern lives. To deliver value to our audience, we need to create impactful, data-driven journeys.
This is important for data analysts today because we are crafting the interaction with data for our audience to consume. The audience is overwhelmed with information, yet they need information to survive and function. This dichotomy is the challenge of our time and has seen data visualizations rise in record numbers to bridge this gap and make information more consumable. To break into the audience’s trusted network of information, analysts need to create impact with their information products, especially data dashboards.
Dashboards
A common type of data project that sets the foundation for modern data visualization is a dashboard. People often start the history of data visualization with hieroglyphs or cave paintings; however, more recently with big data transformation, the origins are more consistent with business intelligence software tools and dashboards. The origins of the dashboard from the practical and literal to the modern use as a form of interface to data science, the term has had a journey well before this book was written. The following definitions are useful to understand a dashboard and decide what this means for the modern analyst. Webster’s definitions are great to get the essence of the word dashboard as there is some history here.
A dashboard was:
“a screen on the front of a usually horse-drawn vehicle to intercept water, mud, or snow”
Or as time marched on:
“a panel extending across the interior of a vehicle (such as an automobile) below the windshield and usually containing instruments and controls”
(Merriam-Webster)
The origin of the word dashboard is interesting and sits at the heart of technical advancement but is also a continued nod to the past. Originally used to describe a horse-drawn carriage’s kick board, the dashboard was used to keep drivers safe and stop mud and dirt from hitting them. This term evolved over time and was continued to be used as the modern carriages with motors came into use like the automobile and other instrumentation. This instrumentation shows the performance of the vehicle in real time and over time – with very narrow parameters.
The modern use of the word dashboard harkens back to that era, and now we travel the world each minute on our smart devices and the internet. As was true in the past, a dashboard protected the user from the dirt and mud of what was being kicked up, which still holds true for data visualization today. Let’s take a look at what a modern data dashboard is:
“a dashboard is a user interface that, somewhat resembling an automobile’s dashboard, organizes and presents information in a way that is easy to read. However, a computer dashboard is more likely to be interactive than an automobile dashboard.”
(Whatis.com)
The modern dashboard keeps this principle and extends it to vast nuance of data and meaning. Now the dashboard can show data and performance of a single item, a collection of items on a single topic, or even a collect...