With the constant evolution of change in healthcare from both a technology and governmental perspective, it is imperative to take a step back and view the big picture. Relying on hunches or beliefs is no longer sustainable, so avoid jumping to conclusions and making decisions without thoroughly understanding the statistics being analyzed. The triple aim of statistics is a conceptual model laying the foundation for improving healthcare outcomes through statistics. This foundation is: know your numbers; develop behavioral interventions; and set goals to drive change.
With the availability of electronic data sources, the quantity and quality of data have grown exponentially to the point of information overload. Translating all this data into words that tell a meaningful story is overwhelming. This book takes the reader on a journey that navigates through this data to tell a story that everyone can understand and use to drive improvement. Readers will learn to tell a narrative story based on data, to develop creative, innovative and effective solutions to improve processes and outcomes utilizing the authors' tools. Topics include mortality and readmission, patient experience, patient safety survey, governmental initiatives, CMS Star Rating and Hospital Compare.
Storytelling with Data in Healthcare combines methodology and statistics in the same course material, making it coherent and easier to put into practice. It uses storytelling as a tool for knowledge acquisition and retention and will be valuable for courses in nursing schools, medical schools, pharmacy schools or any healthcare profession that has a research design or statistics course offered to students. The book will be of interest to researchers, academics, healthcare professionals, and students in the fields of healthcare management and operations as well as statistics and data visualization.
Frequently asked questions
How do I cancel my subscription?
Simply head over to the account section in settings and click on “Cancel Subscription” - it’s as simple as that. After you cancel, your membership will stay active for the remainder of the time you’ve paid for. Learn more here.
Can/how do I download books?
At the moment all of our mobile-responsive ePub books are available to download via the app. Most of our PDFs are also available to download and we're working on making the final remaining ones downloadable now. Learn more here.
What is the difference between the pricing plans?
Both plans give you full access to the library and all of Perlego’s features. The only differences are the price and subscription period: With the annual plan you’ll save around 30% compared to 12 months on the monthly plan.
What is Perlego?
We are an online textbook subscription service, where you can get access to an entire online library for less than the price of a single book per month. With over 1 million books across 1000+ topics, we’ve got you covered! Learn more here.
Do you support text-to-speech?
Look out for the read-aloud symbol on your next book to see if you can listen to it. The read-aloud tool reads text aloud for you, highlighting the text as it is being read. You can pause it, speed it up and slow it down. Learn more here.
Is Storytelling with Data in Healthcare an online PDF/ePUB?
Yes, you can access Storytelling with Data in Healthcare by Kevin Masick, Eric Bouillon in PDF and/or ePUB format, as well as other popular books in Business & R&D. We have over one million books available in our catalogue for you to explore.
“Bridging your analytical left brain with your artistic right brain”
Introduction
Now that you know more about us, let’s start our journey together to build or enhance your skill set to be more comfortable and confident with interpreting/presenting statistics and leveraging statistics to drive change. Think about your response to the question: “Does the idea of analyzing statistics or presenting statistics make you nervous?” If you are hesitant on standing in front of your peers to explain data or drive home a message using statistics, then you’re not alone. You’re not alone with feelings of anxiety or fear while presenting statistics. Statistics is a language itself and one that is not always easily understood or spoken. Sure, it’s possible to push through the presentation, but you risk someone not understanding or asking a question you don’t know the answer to. Our goal throughout this journey is to teach skills to enhance your confidence when presenting statistics. We want to treat this opportunity as a second chance to make a first impression with statistics. We want to teach you the language of statistics that will transform numbers to life through storytelling.
The beginning of every story starts with knowing your numbers. You may think you know your numbers and data, but simply looking at a number doesn’t indicate knowledge of the analysis or method used to derive those results. Think of the most recent presentation that you either presented or listened to that involved data. Did the presentation go well? Was the message clear and effective? Was everything known about the calculation of the numerator, denominator, and the rate/index/ratio? Did you know/understand the methodology used to arrive at those numbers? Do you know what to do to implement change? Did the presentation give the audience that “aha” moment when the light bulb went on and they knew what to do next? If you said “no” to at least one of those questions, then you’re in the right place.
The goal by the end of this book is to enhance or fine tune your skills by incorporating techniques/tools to effectively explain statistics and leverage the power of storytelling with data. In reflecting back to sitting in a high school math class, we wondered how it was possible to multiply or add letters in an equation. The concept of multiplying various letters or having a letter mean something other than the ones used to create words that make up sentences is confusing. When looking at art or a photograph and feelingan emotional connection, why is it possible to describe how you feel in words? If a picture is worth a thousand words, then why can’t numbers be? Thinking about the relationship between numbers and how they translate to words is complex. Part of the complexity may be a result of the left side of the brain being analytical and logical and the right side of the brain being creative and innovative. Storytelling with statistics is when the left side of the brain invades the right side.
In reflecting on a personal experience during a presentation in a high school math class, students were presented the challenge of using pictures to tell a story. Students were shown a picture of Cinderella’s castle in Walt Disney World, an image of the Rorschach ink blot test, and then a control chart. A lively discussion of Walt Disney World ensued with many different personal and emotional stories. The Rorschach inkblot generated conversations and laughs where students were still able to see the story within an abstract image. Then it happened. The deafening silence that creates a sense of feeling uncomfortable. The presence of a control chart caused the room to go immediately silent with no student making eye contact for fear of being randomly called on to answer a question when they didn’t know the answer. In our minds, we wondered why and how it was possible to go from genuine enthusiasm to laughter to pure fear and anxiety with three different pictures. All three images capture a moment in time when the only change is the content of the image. Why can’t all images or pictures capture the same enthusiasm as Cinderella’s castle or a Rorschach test? Is it a fear of the unknown or lack of confidence in how to analyze an image? We subsequently presented the same story to healthcare professionals, healthcare technology leaders, and a group of organizational professionals, with similar results.
At this moment, we realized that not everyone sees statistics as both an art and a science – the analytical science behind the statistical calculations and the art to transform statistics into a language that brings the data to life. Statistics as a science is the analytical aspect of using numbers to solve problems or answer questions. Statistics as an art is transforming these numbers into words to create an effective story used to drive change. This is exactly what we hope to will do! Throughout the rest of our journey together we are going to teach you skills to speak the language of statistics. Before we begin, let’s reflect on setting the stage of where we are at this present moment.
Evolution of Healthcare Analytics
Years ago decisions either relied on presenting averages or percentages to demonstrate outcomes or were made using hunches, beliefs, or previous experience. At this time statistics were used to monitor compliance metrics over time. While it is important to monitor compliance, changes in reimbursement and accountability force organizations to utilize performance-based metrics. Part of this drive is attributed to continual change in technology that has given us access to data within healthcare that wasn’t attainable in the past. Other drives are to reduce cost and improve accountability for providing care along the entire continuum.
Focusing on the facts presented is the current and future best practice of making decisions to drive sustainable change. Healthcare data has evolved, and leaders are more sophisticated by asking more challenging questions, which require advanced statistics beyond percentages or means. Questions being asked require p values to compare groups or use advanced statistical models to predict outcomes or combine metrics for an overall comparative rating or leverage the power of technology for machine learning/artificial intelligence. Statistics are necessary to understand the significance of interventions and how to improve care. This evolution towards big data, predictive modeling, artificial intelligence, natural language processing, or machine learning in healthcare is inevitable and already happening.
Healthcare is a complex environment and advances in technology, governmental regulatory agencies, and human interaction, where individuals often have a split second to make decisions, create a multitude of potential red flags for effectively changing behavior. Care is not only provided in a hospital. Patients are treated in multiple settings, such as: ambulatory surgery, clinics, urgent care, physician offices, ambulances, nursing homes, home, free-standing emergency departments, or any public location. Regardless of where care is delivered, metrics exist to measure performance. Change occurs quickly and frequently in healthcare, as new technologies and patient care techniques are being researched and implemented all the time. As a healthcare professional, you not only have to know the clinical side to patient care, but also need to be aware of issues that may be beyond your control.
The federal government, along with the Centers for Medicare/Medicaid Services (CMS) and the Joint Commission, is becoming stricter in the delivery of healthcare by implementing financial penalties based on performance. Likewise, there may be state regulatory agencies, like the State Department of Health, healthcare lobbying organizations, and many outside agencies that provide data to the public (i.e., Press Ganey, Centers for Disease Control, Agency for Healthcare Research and Quality (AHRQ), etc.). There are many healthcare initiatives that must be taken into consideration and monitored, like Pay 4 Performance, Partnership for Patients, Value-Based Purchasing (VBP), Bundled Payments, CMS Star Rating, Affordable Care Act (ACA), Leapfrog, US News, and World Reports. All of these initiatives can be overwhelming to know and understand, since minimal focus during your education may be on statistics or research methodology.
As a healthcare professional, do you feel overwhelmed by the volume of metrics that you are required to monitor? Are you faced with doing more with less? Do you feel that you are being told to improve patient care and the overall patient experience while driving down cost and remaining efficient? Does the Triple Aim sound familiar? The Triple Aim was initiated by the Institute for Healthcare Improvement (IHI) to simultaneously improve the patient experience, improve the health of populations, and reduce cost (www.ihi.org). How easy is it for you to know the details on all metrics of the CMS Star system, the hundreds of metrics requiring improvement in your organization, or the financial penalty you will be hit with? This seemingly impossible task can be possible with the right tools and techniques.
For every intervention developed, every goal achieved, every patient experience improved, every financial incentive earned, know that everyone else will continue to improve, so goals set today may not be sufficient tomorrow. We are all on the same trajectory towards improving the overall patient experience, improving care, and decreasing cost. The competition and stakes get higher with every national benchmark you achieve and every goal you exceed. As the world continues to improve, the chance of becoming the top performer seems out of reach. So you’ve decreased mortality rates by 50%? Well, that 50% reduction over the course of 5 years may have been fantastic, but to get to the top you have to cut it by 50% again. The never-ending battle to become #1 becomes increasingly difficult when the target moves.
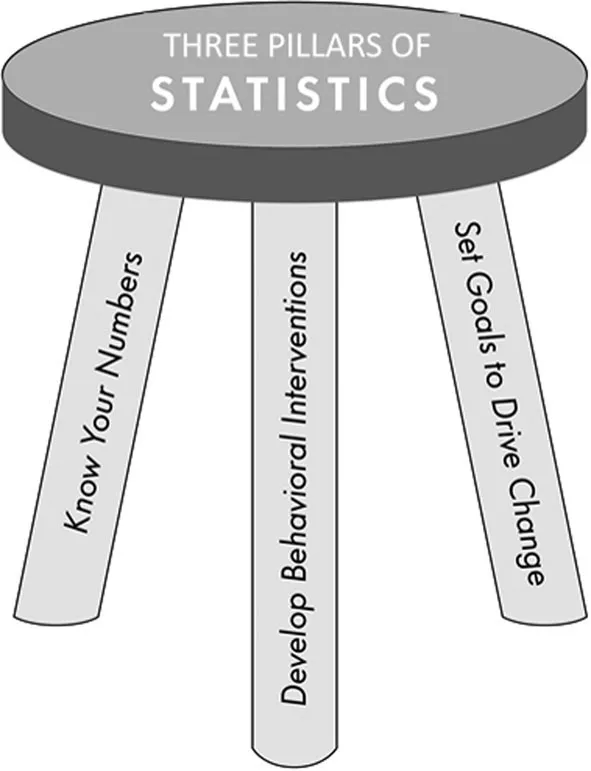
Despite the constant determination to get to the top, the basic principles at the bottom don’t change. Analyzing data methodologically ensures a greater understanding and appreciation of what you’re looking at and provides the depth of knowledge to internalize results and ask the right questions. Remember, the pathway to storytelling with data begins with STATISTICS. Never lose sight of the purpose of what you are trying to do. Every statistical analysis begins with a foundation that we call the Three Pillars of Statistics (Figure 1.1).
1.Know your numbers – critically think, evaluate, and DEFINE statistics.
2.Develop behavioral interventions – know how you’re being measured and create processes to change behavior through a focus on the FACTS.
3.Set goals to drive change – STOP to develop achievable methodological goals to drive change.
Figure 1.1Three Pillars of Statistics.
Change starts with a solid foundation. Removing any one leg from the stool results in the stool falling over. The Three Pillars of Statistics is our conceptual framework that utilizes out toolkit to drive and develop critical thinking, systematic thinking, and statistical agility. We created tools to aid in critical thinking. We used research methodology to guide the development of our STATISTICS model to encourage systematic thinking. We intertwined statistics with applied healthcare examples to enhance statistical agility for storytelling.
Know Your Numbers
One critical aspect of any statistical analysis is to know your numbers. Some people may think that knowing numbers means knowing a mortality rate, infection rate, readmission rate, or most recent patient satisfaction score. There is more to a number than the value itself. For example, a 12.7% mortality rate calculated by your organization is likely a raw rate while a 12.7% mortality rate provided by CMS is a risk-adjusted rate. Both rates may be the same, but their interpretation is different. Every number is comprised of a formula used to calculate a raw rate (i.e., an actual observed rate), a risk-adjusted index/ratio (i.e., a logistic regression modeling technique), or any other calculation that you can think of (i.e., confidence interval, odds ratio, percentile ranks, standard deviation, etc.). Every value has a theory or rationale behind the calculation. Taking a step back to understand this methodology provides a greater appreciation and internalization of the data.
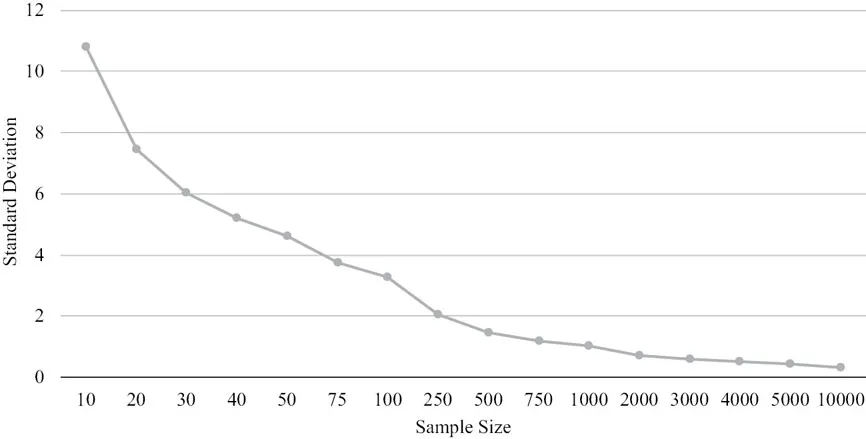
Within every metric, there is a methodology used to derive that number. Breaking apart formulas and understanding the methodology provide a clearer picture of what is measured. A common statistical term, standard deviation is a measure of variability around the mean or how much variation there is within a metric (see Figure 1.2 for the formula). Pay careful attention to the letter n in the formula as that is the sample size. This is important for two reasons: (1) a larger sample size equals a lower standard deviation; and (2) a smaller sample size equals a larger standard deviation. Figure 1.3 is a graphical representation depicting changes in standard deviation based on sample size. This is an important factor when analyzing any data involving standard deviation (i.e., a control chart), because additional insights or stories can emerge.
Figure 1.2Standard Deviation.
Figure 1.3Standard Deviation by Sample Size.
Develop Behavioral Interventions
In addition to knowing your numbers, an effective way to hit moving targets is to develop behavioral interventions to drive sustainable change. Changing behavior is hard, but understanding past behavior is the best predictor of future performance (Wernimont & Campbell, 1968). Understanding how to change behavior begins with understanding change. This spectrum of change ranges from laggards (those resistant in their response to change) to early adopters (those quick to respond to change) (Rogers, 2010). There is an equally small percentage of people who both love and hate change, with more than...