![]()
CHAPTER 1
What is Sound?
CHAPTER CONTENTS
A Vibrating Source
Characteristics of a Sound Wave
How Sound Travels in Air
Simple and Complex Sounds
Frequency Spectra of Repetitive Sounds
Frequency Spectra of Non-Repetitive Sounds
Phase
Sound in Electrical Form
Displaying the Characteristics of a Sound Wave
The Decibel
Sound Power and Sound Pressure
Free and Reverberant Fields
Standing Waves
A VIBRATING SOURCE
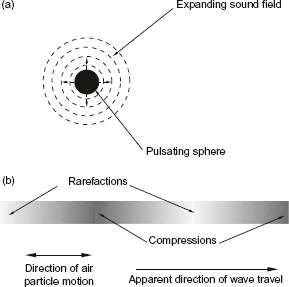
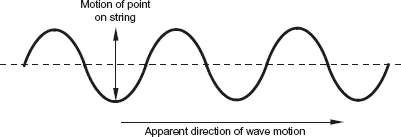
Sound is produced when an object (the source) vibrates and causes the air around it to move. Consider the sphere shown in Figure 1.1. It is a pulsating sphere which could be imagined as something like a squash ball, and it is pulsating regularly so that its size oscillates between being slightly larger than normal and then slightly smaller than normal. As it pulsates it will alternately compress and then rarefy the surrounding air, resulting in a series of compressions and rarefactions traveling away from the sphere, rather like a three-dimensional version of the ripples which travel away from a stone dropped into a pond. These are known as longitudinal waves since the air particles move in the same dimension as the direction of wave travel. The alternative to longitudinal wave motion is transverse wave motion (see Figure 1.2), such as is found in vibrating strings, where the motion of the string is at right angles to the direction of apparent wave travel.
FIGURE 1.1
(a) A simple sound source can be imagined to be like a pulsating sphere radiating spherical waves. (b) The longitudinal wave thus created is a succession of compressions and rarefactions of the air.
FIGURE 1.2
In a transverse wave the motion of any point on the wave is at right angles to the apparent direction of motion of the wave.
CHARACTERISTICS OF A SOUND WAVE
The rate at which the source oscillates is the frequency of the sound wave it produces, and is quoted in hertz (Hz) or cycles per second (cps). 1000 hertz is termed 1 kilohertz (1kHz). The amount of compression and rarefaction of the air which results from the sphere’s motion is the amplitude of the sound wave, and is related to the loudness of the sound when it is finally perceived by the ear (see Chapter 2). The distance between two adjacent peaks of compression or rarefaction as the wave travels through the air is the wavelength of the sound wave, and is often represented by the Greek letter lambda (?). The wavelength depends on how fast the sound wave travels, since a fast-traveling wave would result in a greater distance between peaks than a slow-traveling wave, given a fixed time between compression peaks (i.e. a fixed frequency of oscillation of the source).
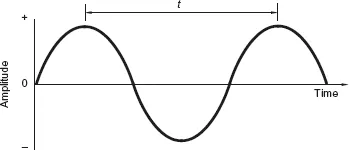
FIGURE 1.3
A graphical representation of a sinusoidal sound waveform. The period of the wave is represented by t, and its frequency by 1/t.
As shown in Figure 1.3, the sound wave’s characteristics can be represented on a graph, with amplitude plotted on the vertical axis and time plotted on the horizontal axis. It will be seen that both positive and negative ranges are shown on the vertical axis: these represent compressions (+) and rarefactions (−) of the air. This graph represents the waveform of the sound. For a moment, a source vibrating in a very simple and regular manner is assumed, in so-called simple harmonic motion, the result of which is a simple sound wave known as a sine wave. The simplest vibrating systems oscillate in this way, such as a mass suspended from a spring, or a swinging pendulum (see also ‘Phase’, p. 8). It will be seen that the frequency (f) is the inverse of the time between peaks or troughs of the wave (f=1/t). So the shorter the time between oscillations of the source, the higher the frequency. The human ear is capable of perceiving sounds with frequencies between approximately 20Hz and 20kHz (see ‘Frequency perception’, Chapter 2); this is known as the audio frequency range or audio spectrum.
HOW SOUND TRAVELS IN AIR
Air is made up of gas molecules and has an elastic property (imagine putting a thumb over the end of a bicycle pump and compressing the air inside — the air is springy). Longitudinal sound waves travel in air in somewhat the same fashion as a wave travels down a row of up-ended dominoes after the first one is pushed over. The half-cycle of compression created by the vibrating source causes successive air particles to be moved in a knock-on effect, and this is normally followed by a balancing rarefaction which causes a similar motion of particles in the opposite direction.
It may be appreciated that the net effect of this is that individual air particles do not actually travel — they oscillate about a fixed point — but the result is that a wave is formed which appears to move away from the source. The speed at which it moves away from the source depends on the density and elasticity of the substance through which it passes, and in air the speed is relatively slow compared with the speed at which sound travels through most solids. In air the speed of sound is approximately 340 meters per second (m s−1), although this depends on the temperature of the air. At freezing point the speed is reduced to nearer 330 ms−1. In steel, to give an example of a solid, the speed of sound is approximately 5100ms−1.
The frequency and wavelength of a sound wave are related very simply if the speed of the wave (usually denoted by the letter c) is known:
To show some examples, the wavelength of sound in air at 20Hz (the low-frequency or LF end of the audio spectrum), assuming normal room temperature, would be:
whereas the wavelength of 20kHz (at the high-frequency or HF end of the audio spectrum) would be 1.7cm. Thus it is apparent that the wavelength of sound ranges from being very long in relation to most natural objects at low frequencies, to quite short at high frequencies. This is important when considering how sound behaves when it encounters objects — whether the object acts as a barrier or whether the sound bends around it (see Fact File 1.5).
SIMPLE AND COMPLEX SOUNDS
In the foregoing example, the sound had a simple waveform — it was a sine wave or sinusoidal waveform — the type which might result from a very simple vibrating system such as a weight suspended on a spring. Sine waves have a very pure sound because they consist of energy at only one frequency, and are often called pure tones. They are not heard very commonly in real life (although they can be generated electrically) since most sound sources do not vibrate in such a simple manner. A person whistling or a recorder (a simple wind instrument) produces a sound which approaches a sinusoidal waveform. Most real sounds are made up of a combination of vibration patterns which result in a more complex waveform. The more complex the waveform, the more like noise the sound becomes, and when the waveform has a highly random pattern the sound is said to be noise (see ‘Frequency spectra of non-repetitive sounds’, p. 7).
The important characteristic of sounds which have a definite pitch is that they are repetitive: that is, the waveform, no matter how complex, repeats its pattern in the same way at regular intervals. All such waveforms can be broken down into a series of components known as harmonics, using a mathematical process called Fourier analysis (after the mathematician Joseph Fourier). Some examples of equivalent line spectra for different waveforms are given in Figure 1.4. This figure shows another way of depicting the characteristics of the ...