![]()
CHAPTER 1
The Reality of Being Data Driven and Why Your Company Isn’t
The only way to make sense out of change is to plunge into it, move with it, and join the dance.
—Alan Wilson Watts
There were dashboards everywhere,1 monitoring activity across the network and showing the latest news from CNN, MSNBC, and Fox News. If anything unusual happened, you would instantly see it on one of the monitors. The company could then respond right away and prevent any serious consequences.
This was the “War Room” that Facebook had set up to monitor the U.S. midterm elections in 2018. The company has built special dashboards to monitor fake news, bots trying to spread misinformation, and nefarious actors.
This might seem over the top for Facebook but the company has been under ever-increasing pressure for its role in the 2016 U.S. presidential election. It had become public that foreign organizations were able to use Facebook to influence the outcome of that election. The “War Room” was a response to all of this but it is unclear if it will be enough.
Facebook is an extreme example of a company that uses data to make decisions. The company uses this data to show you exactly what you care about when you browse your newsfeed and hopes that you stick around for longer than necessary. Their data-driven decisions work. In 2019, 1.62 billion people used one of its products on a daily basis2 including Whatsapp, Instagram, or Messenger.
While most companies will never reach the level Facebook has, it does show the potential impact that data can have on any organization. This book is your guide to getting more value out of your data.
You don’t need to go to the same level Facebook has. For them, data is their business. Everything else is mostly there to support the collection of data. For other businesses, data is meant to support your core value which could be products or services.
In this book, we’ll look at everything you need to do to get data right. Let’s start our journey at the beginning, by providing context.
Let’s Start at the Beginning
Every great story has a beginning and, for companies that are striving to be data driven, the beginning can feel like a failure. Every single one of my clients tells me that that they would like to go from nothing to advanced as quickly as possible. They want to skip the beginning and jump to the end of the story.
They assume (rightly so) that they aren’t limited by technology. We have advanced computers that fit into our pants and self-driving cars. I’m sure we can figure out how our customers engage with our products. The latter seems simplistic in comparison to other technologies.
The mistake is to assume that we are talking about technical problems. In this book, we’ll talk about tools, machine learning models, and other technical ideas but I don’t think they are the main issues that companies need to solve.
Instead, my experience over the past five years tells me that the biggest challenges are related to people and psychology. These issues manifest when your team tells you that they don’t trust the data or when they outright reject a number because “it can’t be right.”
A mentor once told me that we should always look for “cause, not blame.”3 Blaming people isn’t the solution. Instead, we need to diagnose why this lack of trust exists or why it seems that some teams are unable to actually use the data they have.
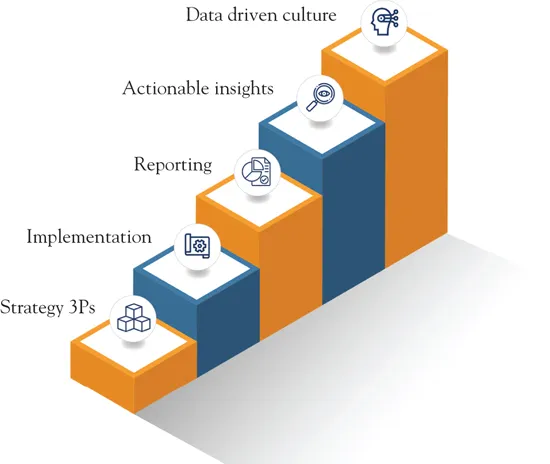
Figure 1.1 Data Adoption Lifecycle (DAL)
This is the journey that we will take in this book. I’ll give you the best tools for your product or industry, show how advanced techniques like machine learning can help your business, and demystify data science into practical applications. This is what companies want when they reach out to me but it isn’t always what they need.
Diagnosing this gap between want and need is sometimes tricky. To help prospects understand it, I use a simple model that I call the “Data Adoption Lifecycle (DAL)” (Figure 1.1).
Everything starts with the strategy which we will cover in Chapter 2. Once we have a plan that makes sense, we can move on to the implementation which we will cover in Chapters 3 and 4. After collecting data, we can go through a reporting phase which we will cover in Chapter 5.
This is where things start to get interesting. Once a company has some reports, we need to work through all the issues to extract actionable insights. We will cover all of these in Chapters 6 to 9.
Finally, we can work on establishing a data-driven culture that isn’t just words on a wall. We will cover this in Chapter 10.
The great thing about the DAL model is that it allows companies to be in-between stages. You may have an ok strategy but a great implementation or solid reporting but limited insights. This represents a reality where most companies are doing fine in some areas and could do better in others.
In this book, my goal is to help you get better at every stage while still focusing on driving meaningful changes in your business. That being said, we will need to walk before running and in some cases, we’ll have to crawl.
Walk before You Run (or Crawl)
We live in a culture of instant gratification that has changed how we think about the world. This isn’t just something that is happening to teenagers but everyone has had their expectations warped.
Let me give you an example from my life. I live in Vancouver, Canada, where until recently (early 2020), we didn’t have Uber or Lyft. To catch a cab, you either had to hail one from the street or call for one. The first option is not something I’m personally familiar with and feels inefficient. The second option could easily take upwards of 30 minutes before a taxi arrived at your house.
Fast forward to today, we now have a third option: book an Uber or Lyft. The first few times were great but when the novelty wore off, I noticed that I would get frustrated if I had to wait more than five minutes for the Uber/Lyft. My expectations on how quickly taxis should arrive changed within days of the arrival of Uber and Lyft.
This is why I understand when executives feel frustrated with their lack of data and lack of progress in this area. Why can’t we just solve this problem and move on?
Unfortunately, moving groups of people in a specific direction takes time. Getting people on board, shifting priorities, and making technical changes are all time consuming. Data also suffers from a fourth limitation which is the time it takes to actually collect it.
Most of my clients have tried to get to the future but are making little progress. You may be running fast but if you’re doing that on a treadmill, you won’t go anywhere. This is where the DAL comes in handy. It gives us a simple map to understand what we need to tackle next and what we can worry about later.
We also need to think about rebuilding the trust in data and its purpose. I find that some of my clients have burned bridges trying to get data strategies implemented. A common example is engineering teams who have been asked repeatedly to implement tools just to see those efforts go to waste. They eventually become skeptical of any data initiatives and this is something that needs to be worked through.
That being said, companies can make great progress in 30 days or less especially if you’re organized and tackle things in the right order. Before you ever ask any of your engineers to write code, you’ll have a solid plan that has been thought out and tested for weaknesses. That is our goal in this book and one that we can work together on.
Case Studies of Successful Data-Driven Organizations
To understand where we are going, we need to look at those who are already there. I want to walk you through three case studies of how companies have used to drive growth within their business.
Even though these businesses might have significantly more resources than you, remember that technical limitations are rarely the main issue and instead they have to deal with the human problems at a larger scale than yourself.
One of my favorite companies is Spotify, the music app service. I use their product every day; I’m a paying user and a huge proponent of it. They also happen to have one of the best data programs in the industry.4 One of the key aspects of the product is their curated playlists which Spotify generates automatically based on popular songs. You have playlists of the most popular Beatles songs, relevant workout songs, and songs to put you to sleep.
Spotify uses its usage data to show every user relevant new playlists that were built to their tastes. They also release this data to artists so they can see what users are listening to and how they are discovering their music. They also have their own internal framework for how to use data to make better decisions which they call DIBB (Data-Insight-Belief-Bet).5 We’ll be talking more about these kinds of frameworks in Chapter 7.
Another great case study is Airbnb, the marketplace for finding and booking rooms. They have used data extensively to improve the booking process, making it easier for hosts to accept bookings and even in how they built their data science team to be gender balanced.6
They have also contributed quite a few projects to the open source world including Apache Superset, Omniduct, an...