![]()
1 Overview of Trade Forecasts in the Pacific Region
1.1 Overview
This chapter presents the baseline trade volume and freight flows for the Pacific developing member countries (DMCs) that participated in the study. These are Fiji, Papua New Guinea, Samoa, Timor-Leste (footnote a), Tonga, and Vanuatu (hereinafter referred to as the six Pacific DMCs). At the time of the study, the base year was defined as 2015. The import and export values of each country for the base year and forecast years of 2025 and 2035 were produced.
1.2 Imports and Exports Value Profile
The most striking aspect of their imports value profile, which is common across the six Pacific DMCs, is that a large proportion goes to mineral products, which mainly consist of refined petroleum products ranging from heavy fuel oils used for electricity generation to distilled diesel and petrol (gasoline) fuels, and the contribution of other minerals (such as ores and cement clinker) in value terms is negligible. Industrial and commercial machinery, mechanical appliances, and vehicles also comprise a big proportion of the imports value profile. This can be affected in value terms by items such as imported passenger aircraft, imported seagoing vessels, and heavy machinery and construction equipment for large infrastructure projects. The dominance of these import items are likely to be overlooked when assessing container volumes as they are mostly imported as bulk liquids (petroleum) and break bulk (machinery and vehicles), although machinery and vehicles are now transported in containers more frequently. Commodity groups 1–31 together comprise the total imports value of food, which generally account for around 20%–30% of imports (Figure 1.1).
Figure 1.1: Import Value Forecasts, 2015 ($ million)
Note:
1. The analyses were conducted based on the international Harmonized System (HS) commodities classification.
2. The international Harmonised System is an international system of names and numbers used to describe trade, developed by the World Customs Organization.
Source: Asian Development Bank (Pacific Department).
The exports value profile of the six Pacific DMCs is much more varied than that of imports, although the smaller countries tend to have limited export opportunities. Most of the smaller countries’ exports consist of animal and vegetable products. These cover fish, vegetables, copra, coffee, and coconut oil which are the primary merchandise exports for Samoa, Tonga, and Vanuatu. Timor-Leste exports are primarily coffee beans with a small amount of other agricultural products. Fiji has one of the most diversified export systems of all, with a broad range of exports including agricultural produce, mineral water, chemicals, textiles, cement, and timber products. Papua New Guinea has the largest export base, with $9.3 billion in exports value in 2015. This is primarily natural resources, with significant exports of petroleum products, mineral/metal resources such as gold and copper, and timber as well as agricultural exports such as coffee. Papua New Guinea’s exports have grown significantly in recent years, led by the mineral products category following the opening of an Exxon-Mobil liquefied natural gas (LNG) facility in 2014 (Figure 1.2).
Figure 1.2: Export Value Forecasts, 2015 ($ million)
Note:
1. The analyses were conducted based on the international Harmonized System (HS) commodities classification.
2. The international Harmonized System is an international system of names and numbers used to describe trade, developed by the World Customs Organization.
Source: Asian Development Bank (Pacific Department).
1.3 Future Imports and Exports Value
The future growth in imports is forecast to be the highest for countries with both high population and high economic growth rates. This includes Timor-Leste and Papua New Guinea and to a lesser extent, Fiji. Countries with lower rates of population and economic growth such as Samoa and Tonga are forecast to have modest growth in imports over the forecast period. The total growth in imports over the 20-year forecasts period is around 40%–50% for most of the six Pacific DMCs.
The scale of export growth differs significantly across the six Pacific DMCs, and although countries such as Timor-Leste may experience strong growth in percentage terms, the magnitude of increases is only in the tens of millions of dollars. For a country of over 1 million people, the impact of these changes is relatively minor. Papua New Guinea, by contrast, is already by far the largest exporter of all and has many export expansion possibilities. The most significant of these is likely to be further expansion of its LNG reserves, the timing of which will depend on the recovery of resource prices.
1.4 Current Trade Patterns
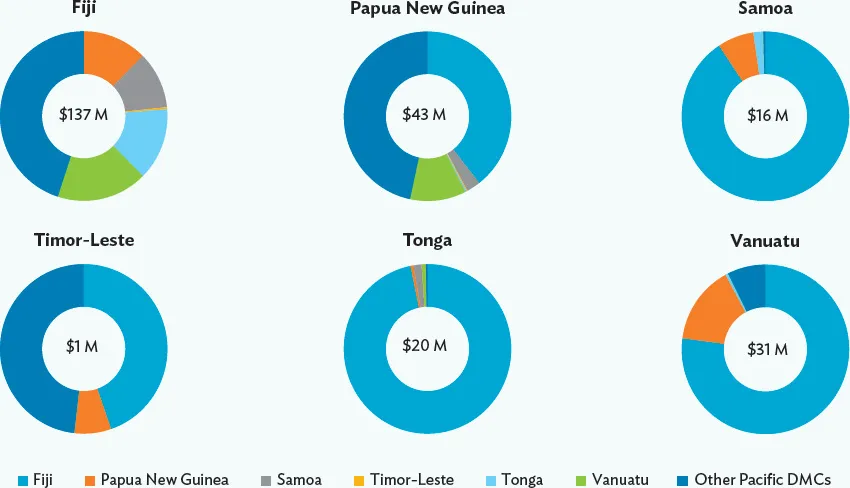
Figure 1.3 shows the pattern of trade between the Pacific DMCs. With the exception of trade with the two largest countries (Papua New Guinea and Fiji), the level of intraregional trade is very low. This is attributed to the small populations of the island archipelago countries and the uniformity of their potential exports reducing the scope for trade.
Figure 1.3: Intra–Pacific Developing Member Countries’ Trade, 2015
DMC = developing member country.
Note: Imports and exports between country pairs have been aggregated (trade value = imports to country A from country B + exports from country A to country B).
Source: Asian Development Bank (Pacific Department).
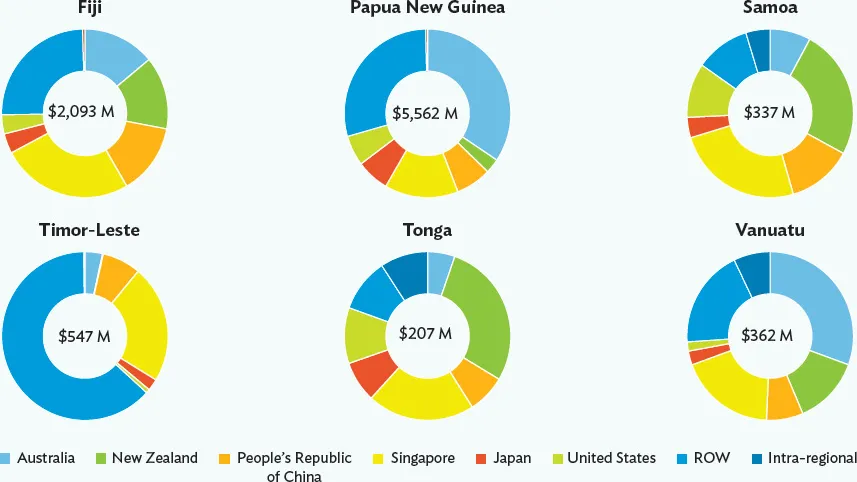
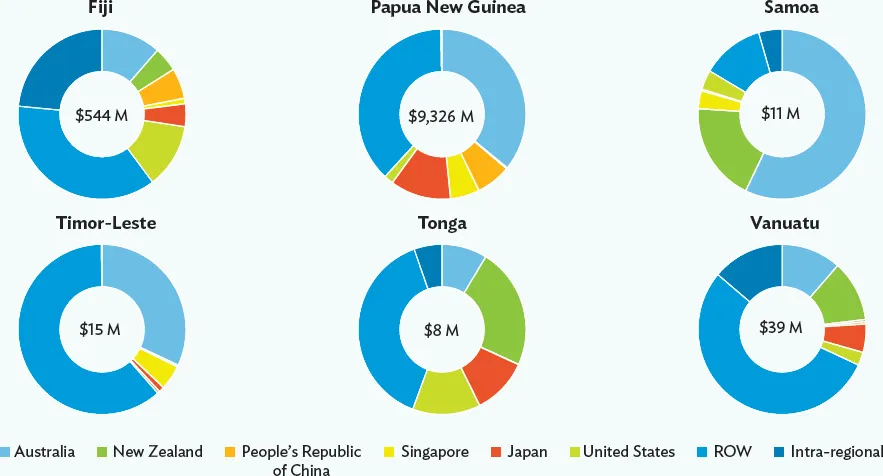
Imports to the six Pacific DMCs (Figure 1.4) are evenly spread across the major trading partners among the Pacific Rim countries, with Singapore having a large share due to its petroleum exports.2 Exports from the six Pacific DMCs (Figure 1.5) are dominated by outputs from Papua New Guinea, which are spread across a number of trading partners.
Figure 1.4: Imports to Six Pacific Developing Member Countries, 2015
ROW = rest of the world.
Note: The figures depict origin of imports to each Pacific developing member country in 2015, while the total value of the trade is shown in the center and is in United States dollars.
Source: Asian Development Bank (Pacific Department).
Figure 1.5: Exports from Six Pacific Developing Member Countries, 2015
ROW = rest of the world.
Note: The figures depict destination of exports from each Pacific developing member country in 2015, while the total value of the trade is shown in the center and is in United States dollars.
Source: Asian Development Bank (Pacific Department).
1.5 Implications for Freight and Logistics Networks
In terms of regional trade, there are no current indications that regional trade flows will significantly change.
While the overall import volumes will increase in absolute terms driven primarily by population and economic growth of each Pacific DMC, it is projected that their profile will largely remain the same and major trading partners among the Pacific Rim countries will continue to be the most important source of imports to the Pacific DMCs.
Most of the smaller Pacific DMCs will continue to produce a relatively homogenous collection of agricultural and fisheries products that will be exported outside the region. There will be continued opportunities for the regional hubs of Fiji and Papua New Guinea to move up the value chain by undertaking processing activities to supply the smaller island nations. However, for the most part the Pacific DMCs will continue to position their primary industries as high-quality export produce aimed at the traditional trading partners in Australia, New Zealand, and the United States, and increasingly the growing middle class in Southeast Asia and East Asia.
This means that while the sea and air networks in the region will need to expand their capacities, the changes in the patterns of trade are unlikely by themselves to drive significant changes in the networks.
![]()
2 Seaports—Freight Shipping Networks and Trade Volume Forecast
2.1 International Freight Shipping Networks in the Pacific
This study focuses mainly on the international freight shipping network in the Pacific. The current capacity and potential future developments to meet the forecast seaborne freight demand have been assessed.
Other than for crude oil and ores exports primarily from Papua New Guinea, the bulk shipping demand comprises mostly refined petroleum imports, supplied almost entirely from refineries in Singapore. Products are distributed by tankers in vessel capacity ranging from 20,000–30,000 tons deadweight (DWT) (Handysized) both directly to individual Pacific DMCs and via the import and transshipment terminal in Suva, Fiji, using seagoing powered barges for onward distribution. Niue is an exception, where fuel that originates from Singapore is supplied from New Zealand in tanktainers.
Global distribution of non-bulk freight by sea is now handled almost entirely by large specialized vessels. New cars and other transport vehicles are carried in large ro-ro (roll-on/roll-off) vessels and, with the exception of large construction components and large fabricated items (for example, quay cranes for large container terminals and offshore oil and gas facility components), freight is wherever possible unitized. Cars (both new and previously used) are delivered from Pacific Rim countries to smaller Pacific DMCs either by mixed ro-ro and container vessels or in containers.
The major intercontinental flows are carried by a small number of large shipping lines and consortia, operating vessels up to 20,000 TEUs in capacity, up to 400 meters in length overall and over 200,000 DWT. These shipping lines carry high volumes of goods across the Pacific between the Pacific Rim countries in vessels of up to about 13,000 TEUs capacity, either directly or via transshipment ports such as Busan (Republic of Korea), Singapore, and Tauranga (New Zealand). In the past, these lines also operated smaller vessels serving the Pacific DMCs (for example, Maersk operated a shuttle service between New Zealand and Fiji), but now only two major lines, CMA CGM and Hamburg Sud, operate long-distance trans-Pacific services calling at ports within the Pacific, although...