In life, we often face unavoidable complexities in terms of our ability to understand or influence outcomes. Some questions which arise due to these complexities are: Why can't the future be made certain? Why do the some people or events always end up at the center of controversy? Why do only a select few get ahead of their peers? Each question pertains to three central elements of complexities and these elements are: uncertainty, inequality and unfairness.
Simplifying Complexity explains the scientific study of complex cognitive networks, as well as the methods scientists use to parse difficult problems into manageable pieces. Readers are introduced to scientific methodology and thought processes, followed by a discourse on perspectives on the three elements of complexity through concepts such as normal and non-normal statistics, scaling and complexity management.
Simplifying Complexity combines basic cognitive science and scientific philosophy for both advanced students (in the fields of sociology, cognitive science, complex networks and change management) and for general readers looking for a more scientific guide to understanding and managing the nature of change in a complex world.
- English
- ePUB (mobile friendly)
- Available on iOS & Android
eBook - ePub
Simplifying Complexity: Life is Uncertain, Unfair and Unequal
About this book
Trusted by 375,005 students
Access to over 1.5 million titles for a fair monthly price.
Study more efficiently using our study tools.
Information
Unfair: A Complex World View
Bruce J. West
Abstract
The linear additive world view, in which uncertainty is described by Normal statistics, is replaced by a nonlinear multiplicative world view in this chapter; the simple yielding to the complex. One consequence of the complex world view is that uncertainty is characterized by inverse power-law, rather than Normal, statistics. The implications of this complex representation of the world are immediate and profound. One inherent advantage is that the complex vantage point provides a single coherent view of disruptive mechanisms in complex phenomena; mechanisms ranging in physical science from earthquakes to floods; in social science from stock market crashes to the failure of power grids; in medical science from heart attacks to flash crashes in health care; and in biological science from the extinction of species to allometry relations. Extrema are more frequent in the complex world than they are in the simple world of Normalcy. The effects of extreme events are certainly unfair, and fortunately they do not occur every day. But when disruptive events do occur they introduce crossroads, and the selection of which road to take determines the subsequent course of events in a person’s life. Consequently, understanding the source of extrema enables an individual to take back control from the hands of fate.
Keywords: Bursting, Complexity, Crashes, Extrema, Fractals, Hospitals, Intermittency, Nonlinear dynamics, Non-normal statistics, Power grids, Quakes, Tipping point, Unfairness.
One of our strongest urges as human beings is to know the future and through that knowledge control our destiny and the destiny of those in our charge. In the first two chapters I reviewed some of the historical evidences that the mental maps of the world we construct for ourselves consist primarily of elements that are linearly connected. Even when I introduced uncertainty into the description of events, as a way of including the influence of the broader world into their development, that uncertainty took the form of small additive random fluctuations. The world’s
ambiguity is represented by the distribution of the fluctuations in the outcomes of experiments and the variability of observations.The functional form of the distribution revealed certain general properties of the world’s influence on simple predictions whether it is my estimate of the stopping distance, when tail gating at 60 mph, or how students react to a change in testing procedures.
In this chapter I examine how the neatly constructed linear world view has been challenged by the complexity of modern society. It is not the case that humans have changed how they construct their mental maps of the world. It is that the linear assumptions made in the past are no longer useful in guiding decisions made when social interactions are long range, multiple, and anonymous. I will indicate how the disintegration of simplicity disrupts our lives and leads to such things as the mismanagement of the health care system, particularly through the dominance of extrema when Normalcy no longer suppresses the outliers. Specifically I am concerned with the form in which the notions of fairness and equity, born in the social unrest and industrialization of the nineteenth and early twentieth century, survive in the data of the twenty-first century; or more accurately how they do not survive.
3.1. The Imbalance
The Italian engineer/economist/sociologist, the Marquis Vilfredo Frederico Damoso Pareto (1848-1923), as the nineteenth century drew to a close, determined the empirical distribution of income within western society for the first time. Pareto had worked as an engineer in business until he was middle aged and with the death of his father and shortly thereafter his mother, he left the business world and after a brief hiatus took a faculty position in Political Science at the University of Lausanne, Switzerland. Being trained as an engineer he was convinced that the social sciences were amenable to the same logical-experimental reasoning as the Natural Sciences. Late in life he justified his perspective in The Treatise on General Sociology [48] with the following:
“Driven by the desire to bring an indispensable complement to the studies of political economy and inspired by the example of the natural sciences, I determined to begin my Treatise, the sole purpose of which - I say sole and I insist upon the point - is to seek experimental reality, by the application to the social sciences of the methods which have proved themselves in physics, in chemistry, in astronomy, in biology, and in other such sciences.” 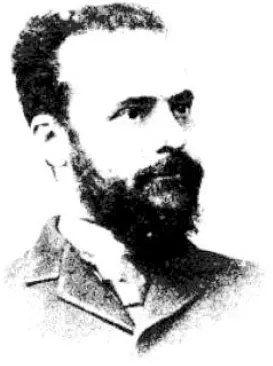
Marquis Vilfredo Frederico Damaso Pareto (1848-1923), engineer, sociologist, economist and philosopher. He made several important contributions to social science, especially in the analysis of individual choice and in the study of income distribution, which he found to follow an inverse power law for high incomes.
Pareto, see Fig. (3.1), was among the first to have the modern vision of society as a network of reciprocal and mutually interdependent elements. Consequently, he viewed social change as a process of action and reaction to maintain the social order, analogous to the then emerging concept of homeostasis in medicine. He reasoned that all social systems are composed of individuals with a distribution of moral, intellectual and physical differences, together, with what he considered to be non-logical actions, resulting from psychic states of sentiment. He consequently determined that the distribution of wealth in western society was not completely random, that is not Normal, but followed a different, but consistent pattern he determined to be inverse power-law. He called the inverse power-law distribution “The Law of the Unequal Distribution of Results” [49] and referred to the inequality in his distribution more generally as a “predictable imbalance”. The surprising result was that the distribution of income not only does not have a peak at the mean value, but it continues outward far beyond what one would reasonably expect from Normal statistics.
Pareto’s imbalance is ultimately interpretable as being implicitly unfair and such inequity is invariably found in complex networks, as has been documented throughout the twentieth and into the twenty-first century. The marked difference between the bell-shaped curve of Gauss, Adrian and Laplace and the inverse power law of Pareto is schematically depicted in Fig. (3.2). The tail of the Pareto distribution extends far beyond the central region of the bell-shaped curve and indicates a lack of a fundamental scale, with which to characterize the process. The loss of a characteristic scale indicates a divergence of the variance in the underlying process. Recall that the argument for using the average value to characterize the erratic outcome of a series of ‘identical’ experiments was that the Normal distribution was narrow and therefore the average was empirically determined to be a good way to represent the data. The width of the Normal distribution is measured by the standard deviation. If the standard deviation becomes very large (diverges) the usual way of determining how well the average value represents the collection of data is no longer valid. In the distribution of income it would mean that the number of dollars between the richest and the poorest in society is much greater than the average income. This loss of a reliable measure presents a major problem for those attempting to understand the world through the use of experimental data and the application of Normal statistics.
One could argue that the distribution of income in the nineteenth century is a weak platform from which to launch a social theory that is at odds with Normalcy. There are many reasons why over a century ago such inequities might exist in the distribution of income and these imbalances can be corrected just as others have been. However, even with the graduated income taxes, the formation of unions, social security and other social/economic mechanisms, it appears that this particular imbalance has yet to be corrected. Some would even argue that the imbalance has increased over the last century, with more of the nation’s wealth being concentrated in the hands of fewer people.
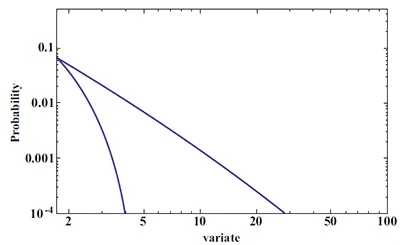
The bell-shaped curve of Gauss, Adrian and Laplace is here compared with the inverse power law of Pareto on log-log graph paper where the Normal distribution is parabolic and the Pareto is a straight line. The long tail of the Pareto distribution is evident, indicating that large events are much more probable in the latter case than in the former and consequently much more important.
In Fig. (3.3) the distribution of income in the United States is indicated for 1980 and 1989 and Pareto’s inverse power-law tail is clearly in evidence. It is true that the rich are different from you and me, particularly in how they use money. The economy of people in the upper 1% of the income level, as indicated in the figure by the Pareto distribution, is characterized mostly by investments. The economy of everybody else is determined by trade, where trade includes trading labor for wages. The existence of a middle class is also evident in the modern distribution and is here modeled by what is called a Gamma distribution, but how that part of the distribution of income is modeled is not relevant to the present discussion. What is of concern is the actual existence of a middle class, a group that did not exist during Pareto’s lifetime and certainly was not present in his data. The inverse power-law tail that Pareto identified persists into the twenty-first century as does the middle class. The Pareto tail has not been legislated away, but the power-law index does change with the 1% level being pushed out to higher income across the decade of the eighties.
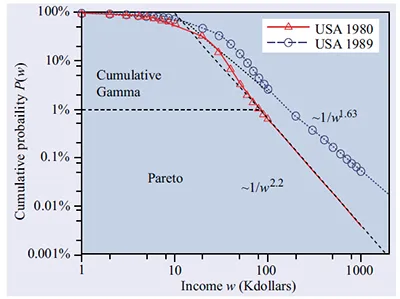
Cumulative probability distributions for income levels in the United States for 1980 and 1989. The tails of both are described by the Pareto distributions with differing power-law indices. The income level ω is in thousands of dollars.
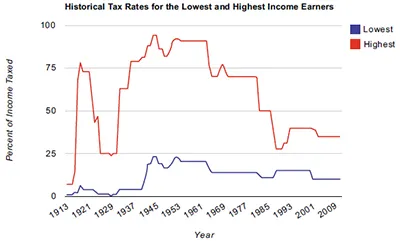
The tax rates for the lowest and highest income earners in the United States over the twentieth century. [Adapted from [50] with permission].
The existence of the middle class may well be a consequence of the various social mechanisms put in place to lessen the imbalance in the income distribution and establish fairness. In Fig. (3.4) is shown one such social mechanism for establishing fairness and that is the graduated income tax. In Fig. (3.4) [50] the historical tax rates for the lowest and highest income earners in the United States for the twentieth century is depicted. Note the drop followed by the sudden rise in the maximum tax rate just prior to the Great Depression. The maximum tax rates of greater than 80% were instituted in response to the tragedy of the depression and were intended to reduce the social imbalance and establish fairness. What is remarkable is that these tax rates persisted for over a quarter of a century. So how well did they do in establishing fairness?
One measure of the imbalance in income level across society is the Gini Coefficient. Its definition is somewhat technical, but for our purposes it is sufficient to note that a value of zero for this coefficient indicates that everyone within the society has the same income and could correspond to one definition of social fairness. A value of one for this coefficient indicates that all the money has collapsed into the hands of the most wealthy, leaving the rest of society to starve. In Fig. (3.5) the Gini Coefficients for the United States post World War Two are indicated as calculated by David Roper and put online (http://www.roperld.com/economics/IncomeDistribution.htm). A casual inspection shows that the index grew about 10% from 1945 to 1970, while the maximum tax rate was on the order of 80% and was relatively constant after 1970. The coefficient appears to be at most only weakly responsive to the changes in the highest tax rates indicated in Fig. (3.4) that dropped from approximately 70% in 1970 to around 30% in 2009. During this time of substantial change in the maximum tax rate the Gini Coefficient varied only a few percent and seemed to come down a little in the new millennium. The stability of the Gini Coefficient indicates that the rich and the poor have been moving together during the past 30 years without substantial change in the social imbalance contrary to what is often expressed in the popular media. Was that fair?
What happens to the individuals in the top 1% income level as their tax rate is changed so dramatically and the Gini Coefficient remains stable? In Fig. (3.6) the Pareto index for the power-law tail of the income distribution is recorded for the 100 years from 1910 to 2010 also calculated by David Roper. Over the first sixty years it appears that the index steadily increased, reducing the income range controlled by the individuals in the top 1% income level. The Great Depression appears as a downward blip in the power-law index, indicating a temporary constriction of the income span between the rich and the poor. It is interesting that this decrease in value occurs while the maximum tax rate is at an all-time low and is restored to its upward trend when the tax rate jumps back above 70%. After 1970, an apparently significant year for the United States, the Pareto index reverses direction and begins a steady decrease thereby increasing the income range controlled by individuals in the top 1% income level. If this index were interpreted in isolation the conclusion might be drawn that the income imbalance between the rich and poor was increasing from 1970 to 2010. However the Gini Coefficient in Fig. (3.5) indicates that this interpretation is not correct, because the imbalance remained nearly constant over this forty year period. Consequently if the range of income over which individuals in the top 1% income level have control increased during this period, as suggested by Fig. (3.6), then it follows from the constancy of the Gini Coefficient that the income level of the poor must increase during this period as well. The unfavorable conclusion is that contrary to population belief the rich and the poor both got richer in the past half century.
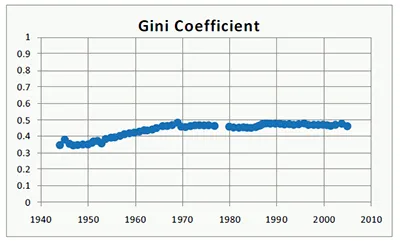
The Gini Coefficient is calculated for each of the years folowing the Second World War using the income tax returns for the United States. A Gini index of zero has no imbalance and a value of one has a complete imbalance. [Adapted from [50] with permission].
A remaining question is whether the complete elimination of the Pareto tail in the income distribution is possible or even desirable? A number of mathematical models yield the result that the loss of imbalance in the distribution of income engenders social instability [51]. Of course a...
Table of contents
- Welcome
- Table of Contents
- Title Page
- BENTHAM SCIENCE PUBLISHERS LTD.
- FOREWORD
- PREFACE
- PROLOGUE
- How Scientists Think
- Uncertain: A Simple World View
- Unfair: A Complex World View
- Unequal: A Matter of Scale
- Complexity Management Principle
- Apology for Complexity
- References
Frequently asked questions
Yes, you can cancel anytime from the Subscription tab in your account settings on the Perlego website. Your subscription will stay active until the end of your current billing period. Learn how to cancel your subscription
No, books cannot be downloaded as external files, such as PDFs, for use outside of Perlego. However, you can download books within the Perlego app for offline reading on mobile or tablet. Learn how to download books offline
Perlego offers two plans: Essential and Complete
- Essential is ideal for learners and professionals who enjoy exploring a wide range of subjects. Access the Essential Library with 800,000+ trusted titles and best-sellers across business, personal growth, and the humanities. Includes unlimited reading time and Standard Read Aloud voice.
- Complete: Perfect for advanced learners and researchers needing full, unrestricted access. Unlock 1.5M+ books across hundreds of subjects, including academic and specialized titles. The Complete Plan also includes advanced features like Premium Read Aloud and Research Assistant.
We are an online textbook subscription service, where you can get access to an entire online library for less than the price of a single book per month. With over 1.5 million books across 990+ topics, we’ve got you covered! Learn about our mission
Look out for the read-aloud symbol on your next book to see if you can listen to it. The read-aloud tool reads text aloud for you, highlighting the text as it is being read. You can pause it, speed it up and slow it down. Learn more about Read Aloud
Yes! You can use the Perlego app on both iOS and Android devices to read anytime, anywhere — even offline. Perfect for commutes or when you’re on the go.
Please note we cannot support devices running on iOS 13 and Android 7 or earlier. Learn more about using the app
Please note we cannot support devices running on iOS 13 and Android 7 or earlier. Learn more about using the app
Yes, you can access Simplifying Complexity: Life is Uncertain, Unfair and Unequal by Bruce J. West in PDF and/or ePUB format, as well as other popular books in Psychology & Cognitive Science. We have over 1.5 million books available in our catalogue for you to explore.