Machine Learning for Knowledge Discovery with R contains methodologies and examples for statistical modelling, inference, and prediction of data analysis. It includes many recent supervised and unsupervised machine learning methodologies such as recursive partitioning modelling, regularized regression, support vector machine, neural network, clustering, and causal-effect inference. Additionally, it emphasizes statistical thinking of data analysis, use of statistical graphs for data structure exploration, and result presentations. The book includes many real-world data examples from life-science, finance, etc. to illustrate the applications of the methods described therein.
Key Features:
Contains statistical theory for the most recent supervised and unsupervised machine learning methodologies.
Emphasizes broad statistical thinking, judgment, graphical methods, and collaboration with subject-matter-experts in analysis, interpretation, and presentations.
Written by statistical data analysis practitioner for practitioners.
The book is suitable for upper-level-undergraduate or graduate-level data analysis course. It also serves as a useful desk-reference for data analysts in scientific research or industrial applications.
Trusted by 375,005 students
Access to over 1.5 million titles for a fair monthly price.
Statistical data analysis has a long history and, over the years, many great statisticians had discussed how it should be properly conducted. The topic has become more important nowadays due to the overwhelming speed of data generation, and how to properly extract meaningful and correct information from massive data has become ever more complicated. In the following, I briefly described the discussions from Fisher, Tukey, Huber, and Mallows of their views of this topic. It is obvious that it is impossible to be exclusive, however, these discussions will at least give us some important perspectives
1.1 Perspectives of Data Analysis
In his paper “On the Mathematical Foundations of Theoretical Statistics,” Fisher [21] stated, “… the object of statistical methods is the reduction of data…. [This] is accomplished by constructing a hypothetical infinite population of which the actual data are regarded as constituting a random sample.” He then identified three problems, which arise in the processes of data reduction:
Problems of Specification. These arise in the choice of the mathematical form of the population.
Problems of Estimation. These involve the choice of methods of calculating statistics, which are designed to estimate the values of the parameters of the hypothetical population.
Problems of Distribution. These include discussions of the distribution of statistics derived from samples.
He assumed that one can capture the essence of the real-world problem in a specification of model(s), which is assumed to be known except for some parameters to be estimated from data. His thinking had substantial influence on the development of statistics, especially mathematical statistics.
Tukey, in his monumental paper “The Future of Data Analysis” [90], stated: “For a long time I have thought I was a statistician, interested in inferences from the particular to the general. But as I have watched mathematical statistics evolve, I have had cause to wonder and to doubt. And when I have pondered about why such techniques as the spectrum analysis of time series have proved so useful, it has become clear that their “dealing with fluctuations” aspects are, in many circumstances, of lesser importance than the aspects that would already have been required to deal effectively with the simpler case of very extensive data, where fluctuations would no longer be a problem. All in all, I have come to feel that my central interest is in data analysis, which I take to include, among other things: procedures for analyzing data, techniques for interpreting the results of such procedures, ways of planning the gathering of data to make its analysis easier, more precise or more accurate, and all the machinery and results of (mathematical) statistics which apply to analyzing data.”
Tukey further stated, “Large parts of data analysis are inferential in the sample-to-population sense, … Large parts of data analysis are incisive, laying bare indications which we could not perceive by simple and direct examination of the raw data, … Some parts of data analysis, …, are allocation, in the sense that they guide us in the distribution of effort and other valuable considerations in observation, experimentation, or analysis. Data analysis is a larger and more varied field than inference, or incisive procedures, or allocation.” He further stated that data analysis must look to a very heavy emphasis on judgment. He considered at least three different sorts or sources of judgment that are likely to be involved in almost every instance: (1) judgment based upon the experience of the particular field of subject matter from which the data come, (2) judgment based upon a broad experience with how particular techniques of data analysis have worked out in a variety of fields of application, and (3) judgment based upon abstract results about the properties of particular techniques, whether obtained by mathematical proofs or empirical sampling. And it is “Far better an approximate answer to the right question, which is often vague, than an exact answer to the wrong question, which can always be made precise.”
In his Fisher memorial lecture, Mallows [51], being a distinguished statistician at the AT & T Bell laboratories, who worked with scientists and engineers from various disciplines, had emphasized that there are problems that precede Fisher’s, namely deciding what the relevant population is, what the relevant data are, and just how these relate to the purpose of the statistical study, in addition to choosing what problem to study.
This kind of thinking has been a required practice in many scientific industries, such as in epidemiology, clinical trials for drug discovery, etc. One often analyzes the observational data, which could be heavily confounded by unobserved factors. Then further validates the findings by conducting trials with rigorous experimental designs, which clearly specify the population of interest and the objectives of study, as well as the specifications of procedures for trial conducts.
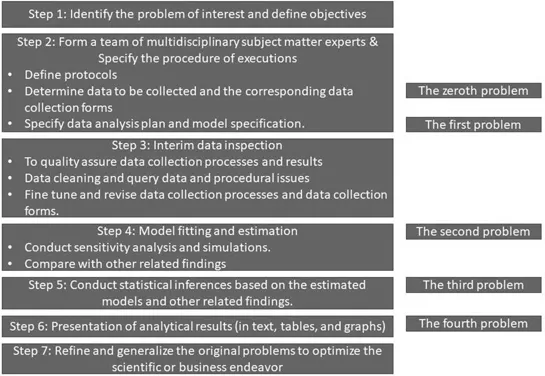
Mallows hence integrated the thinking from Fisher and Tukey and summarized the steps of data analysis into five problems by defining the Zeroth Problem: “Considering the relevance of the observed data, and other data that might be observed, to the substantive problem” before Fisher’s specification of models and the Fourth Problem regarding the presentation of conclusions from data analysis. He also stated that “statistical thinking concerns the relation of quantitative data to a real-world problem, often in the presence of variability and uncertainty. It attempts to make precise and explicit what the data have to say about the problem of interest.”
1.2 Strategies and Stages of Data Analysis
As emphasized by professor Peter Huber, the need for strategic thinking in data analysis is imposed on us by the nature of ever larger data sets. Data analysts need to consider not just the size, but also the facts that large databases are less homogeneous and have more complex internal structure. Data which is heterogeneous in precision, in variation and inevitable incomplete, all impose great challenges to analysts. Data analysis is an iterative and tedious work; therefore, it is important to focus on the important tasks and be flexible in conduct to avoid data dredging to waste time and effort
There is a broad range in the conduct of data analysis. It begins with the identification of the problem of interest, specification of the analysis protocol, and plan including the potential statistical models of interest; henceforward to plan the data collection with good data quality control.
For any extensive and complicated projects, a team of multidisciplinary subject-matter experts is very important so that the various aspects of the project can be explored to avoid the potential difficulties in execution and to produce valid analytical results.
For the planning of data collection, data analysts need to get involved if possible because this will most likely impact the data quality and make later analysis more efficient and valid. Interim data check during the collection processes is important to make sure the collection processes are followed correctly, the intended data are collected, and mistakes are corrected before a great amount of effort and resources are wasted.
For the scenario that data are already existent, it is critical for data analysts to carefully examine the meta-data if available, which usually describes the contents of the data in detail, so that the database can be better understood before planning the data analysis.
Most of the real-world projects have various assumptions for the unknown factors; therefore, it is important to conduct sensitivity analysis (or the so-called what-if analysis) after initial statistical models are fitted so that the impacts of the assumptions can be tested. It is also important to compare the results with other related findings from other research to check the validity of the findings. As professor George Box once said that no model is correct, but some are useful; therefore, flexibility in data modeling is always recommended.
To present the final results, the well thought through graphs and tables is definitely preferred to lines and lines of text. Be careful not to overly crowd the contents of the graphs and tables to the point the messages are lost, and the readers are confused. The steps described above can be tactically summarized as in Figure 1.1.
FIGURE 1.1 Data analysis strategies.
1.3 Data Quality
Data with good quality are the ingredient for analysis. There are many definitions of data quality, however, in engineering, the general scope includes
Degree of excellence exhibited by the data in relation to the portrayal of the actual scenario.
The state of completeness, standards based, validity, consistency, timeliness, and accuracy that make data appropriate for a specific use.
The totality of features and characteristics of data that bear on its ability to satisfy a given purpose: the sum of the degrees of excellence for factors related to data.
The processes and technologies involved in ensuring the conformance of data values to business requirements and acceptance criteria.
In essence, data quality is the degree to which it is complete, valid, accurate, consistent, and timely. In statistics, it adds several other complications, especially in big data.
Big data promises new levels of scientific discovery and economic value. The general expectation of big sample size is that it may give better opportunities to explore the hidden structures of each subpopulation of the data, which is traditionally not as easy when the sample size is small, and to identify important common or uncommon features across many sub populations. However, these expectations are yet to be realized in some greater degrees, primarily due to the data quality and capacity of the analysts. In the following, we describe some common challenges usually facing the analysts during the course of data analysis.
1.3.1 Heterogeneity in Data Sources
Unlike the well-designed experiments that collect well-controlled data, most of the big data are observational and coming from aggregation of several data sets. For example, some data may come from well-controlled studies, some from observational studies, and some could be from past studies, etc. This difference may reflect certain degrees of data quality heterogeneity.
1.3.1.1 Heterogeneity in Study Subject Populations
Some heterogeneity may include differences in subject populations, or regional and cultural differences, the time of data generations. For example, in clinical trials, study subjects can include various demographics such as age, gender, medical histories, genotypes, and phenotypes, etc. Even though the pharmaceutical companies try to have a more homogeneous subject population by imposing restrictive inclusion and exclusion criteria, the population homogeneity still cannot be guaranteed.
1.3.1.2 Heterogeneity in Data due to Timing of Generations
For example, due to the advance of medical research and increased biological understanding of diseases in the past decades, the medical treatment practices during ...
Table of contents
Cover
Half Title
Title Page
Copyright Page
Dedication
Contents
Preface
1 Data Analysis
2 Examining Data Distribution
3 Regressions
4 Recursive Partitioning Modeling
5 Support Vector Machine
6 Cluster Analysis
7 Neural Network
8 Causal Inference and Matching
9 Business
10 Analysis of Response Profiles
Bibliography
Index
Frequently asked questions
Yes, you can cancel anytime from the Subscription tab in your account settings on the Perlego website. Your subscription will stay active until the end of your current billing period. Learn how to cancel your subscription
No, books cannot be downloaded as external files, such as PDFs, for use outside of Perlego. However, you can download books within the Perlego app for offline reading on mobile or tablet. Learn how to download books offline
Perlego offers two plans: Essential and Complete
Essential is ideal for learners and professionals who enjoy exploring a wide range of subjects. Access the Essential Library with 800,000+ trusted titles and best-sellers across business, personal growth, and the humanities. Includes unlimited reading time and Standard Read Aloud voice.
Complete: Perfect for advanced learners and researchers needing full, unrestricted access. Unlock 1.5M+ books across hundreds of subjects, including academic and specialized titles. The Complete Plan also includes advanced features like Premium Read Aloud and Research Assistant.
Both plans are available with monthly, semester, or annual billing cycles.
We are an online textbook subscription service, where you can get access to an entire online library for less than the price of a single book per month. With over 1.5 million books across 990+ topics, we’ve got you covered! Learn about our mission
Look out for the read-aloud symbol on your next book to see if you can listen to it. The read-aloud tool reads text aloud for you, highlighting the text as it is being read. You can pause it, speed it up and slow it down. Learn more about Read Aloud
Yes! You can use the Perlego app on both iOS and Android devices to read anytime, anywhere — even offline. Perfect for commutes or when you’re on the go. Please note we cannot support devices running on iOS 13 and Android 7 or earlier. Learn more about using the app
Yes, you can access Machine Learning for Knowledge Discovery with R by Kao-Tai Tsai in PDF and/or ePUB format, as well as other popular books in Tecnología e ingeniería & Ciencias computacionales general. We have over 1.5 million books available in our catalogue for you to explore.