Build effective analytical data models, reports, and dashboards using the advanced features of Power BI.Purchase of the print or Kindle book includes a free eBook in the PDF format.Key Features• Update your knowledge with new recipes for query optimization, aggregation tables, Power BI API, and paginated reports• Work with recipes across diverse Power BI platforms including the Power BI Service and Mobile Applications• Implement custom solutions with M and DAX languages through actionable guidance and proven development techniquesBook DescriptionThe complete everyday reference guide to Power BI, written by an internationally recognized Power BI expert duo, is back with a new and updated edition. Packed with revised practical recipes, Microsoft Power BI Cookbook, Second Edition, helps you navigate Power BI tools and advanced features. It also demonstrates the use of end-to-end solutions that integrate those features to get the most out of Power BI. With the help of the recipes in this book, you'll gain advanced design and development insight, practical tips, and guidance on enhancing existing Power BI projects. The updated recipes will equip you with everything you need to know to implement evergreen frameworks that will stay relevant as Power BI updates. You'll familiarize yourself with Power BI development tools and services by going deep into the data connectivity, transformation, modeling, visualization, and analytical capabilities of Power BI. By the end of this book, you'll make the most of Power BI's functional programming languages of DAX and M and deliver powerful solutions to common business intelligence challenges.What you will learn• Cleanse, stage, and integrate your data sources with Power Query (M)• Remove data complexities and provide users with intuitive, self-service BI capabilities• Build business logic and analysis into your solutions via the DAX programming language and dashboard-ready calculations• Implement aggregation tables to accelerate query performance over large data sources• Create and integrate paginated reports• Understand the differences and implications of DirectQuery, live connections, Import, and Composite model datasets• Integrate other Microsoft data tools into your Power BI solutionWho this book is forIf you're a BI professional who wants to up their knowledge of Power BI and offer more value to their organization, then this book is for you. Those looking for quick solutions to common Power BI problems will also find this book an extremely useful resource. Please be aware that this is not a beginner's guide; you'll need a solid understanding of Power BI and experience working with datasets before you dive in.
eBook - ePub
Microsoft Power BI Cookbook
Gain expertise in Power BI with over 90 hands-on recipes, tips, and use cases, 2nd Edition
- 654 pages
- English
- ePUB (mobile friendly)
- Available on iOS & Android
eBook - ePub
Microsoft Power BI Cookbook
Gain expertise in Power BI with over 90 hands-on recipes, tips, and use cases, 2nd Edition
About this book
Trusted by 375,005 students
Access to over 1.5 million titles for a fair monthly price.
Study more efficiently using our study tools.
Information
2
Accessing and Retrieving Data
Power BI Desktop contains a rich set of connectors and transformation capabilities that support the integration and enhancement of data from many different sources. These features are all driven by a powerful functional language and query engine, M, which leverages source system resources when possible and can greatly extend the scope and robustness of the data retrieval process beyond what's possible via the standard query editor interface alone. As with almost all BI projects, the design and development of the data access and retrieval process has significant implications for the analytical value, scalability, and sustainability of the overall Power BI solution.
In this chapter, we dive into Power BI Desktop's Get Data experience and walk through the process of establishing and managing data source connections and queries. Examples are provided of using the Power Query Editor interface and the M language directly, to construct and refine queries to meet common data transformation and cleansing needs. In practice and as per the examples, a combination of both tools is recommended to aid the query development process.
A full explanation of the M language and its implementation in Power BI is outside the scope of this book, but additional resources and documentation are included in the sections titled There's more... and See also.
The recipes included in this chapter are as follows:
- Viewing and Analyzing M Functions
- Managing Queries and Data Sources
- Using DirectQuery
- Importing Data
- Applying Multiple Filters
- Selecting and Renaming Columns
- Transforming and Cleansing Source Data
- Creating Custom Columns
- Combining and Merging Queries
- Selecting Column Data Types
- Visualizing the M Library
- Profile Source Data
- Diagnosing Queries
Technical Requirements
The following are required to complete the recipes in this chapter:
- Power BI Desktop
- SQL Server 2019 or newer with the AdventureWorksDW2019 database installed. This database and instructions for installing it are available here: http://bit.ly/2OVQfG7
Viewing and Analyzing M Functions
Every time you click on a button to connect to any of Power BI Desktop's supported data sources or apply any transformation to a data source object, such as changing a column's data type, one or multiple M expressions are created reflecting your choices. These M expressions are automatically written to dedicated M documents and, if saved, are stored within the Power BI Desktop file as Queries. M is a functional programming language like F#, and it is important that Power BI developers become familiar with analyzing, understanding, and later, writing and enhancing the M code that supports their queries.
Getting ready
To prepare for this recipe, we will first build a query through the user interface that connects to the AdventureWorksDW2019 SQL Server database, retrieves the DimGeography table, and then filters this table to a single country, such as the United States:
- Open Power BI Desktop and click on Get Data from the Home tab of the ribbon. Select SQL Server from the list of database sources. For future reference, if the data source is not listed in Common data sources, more data sources are available by clicking More… at the bottom of the list.
- A dialog window is displayed asking for connectivity information. Ensure that Data Connectivity mode is set to Import. Enter the name of your SQL server as well as the AdventureWorksDW2019 database. In Figure 2.1, my SQL server is installed locally and running under the instance MSSQLSERVERDEV. Thus, I set the server to be localhost\MSSQLSERVERDEV to specify both the server (localhost) and the instance. If you leave the Database field blank, this will simply result in an extra navigation step to select the desired database.
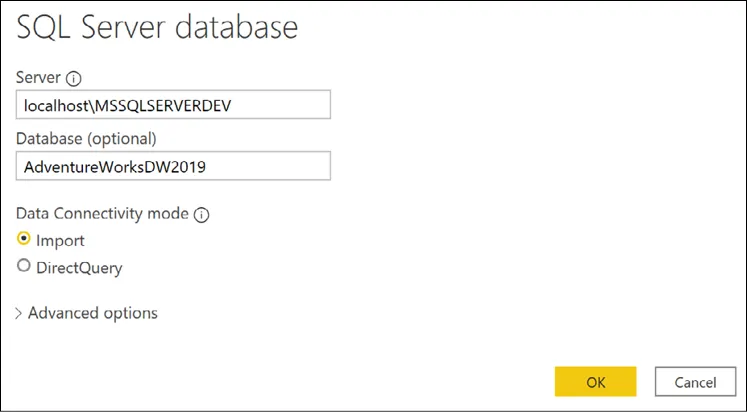 Figure 2.1: SQL Server Get Data dialog
 - If this is the first time connecting to this database from Power BI, you may be prompted for some credentials. In addition, you may also be warned that an encrypted connection cannot be made to the server. Simply enter the correct credentials for connecting and click the Connect button. For the encryption warning, simply click the OK button to continue.
- A navigation window will appear, with the different objects and schemas of the database. Select the DimGeography table from the Navigator window and click the Transform Data button.
- The Power Query Editor launches in a new window with a query called DimGeography; preview data from that table is displayed in the center of the window. In the Power Query Editor window, use the scroll bar at the bottom of the central display area to find the column called EnglishCountryRegionName. You can also select a column and then click Go to Column in the ribbon of the View menu to search for and navigate to a column quickly. Click the small button in the column header next to this column to display a sorting and filtering drop-down menu.Uncheck the (Select All) option to deselect all values and then check the box next to a country, such as the United States, before clicking the OK button.

Figure 2.2: Filtering for United States only in the Query Editor
Note that the button for the EnglishCountryRegionName column changes to display a funnel icon. Also notice that, in the Query Settings pane on the right side of the window, a new option under APPLIED STEPS has appeared called Filtered Rows.

Figure 2.3: The Query Settings pane in the Query Editor
How to View and Analyze M Functions
There are two methods for viewing and analyzing the M functions comprising a query; they are as follows:
- Formula bar
- Advanced Editor
The formula bar exposes the M function for the current step only. This formula bar appears just above the column headers for the preview data in the central part of the window. If you do not see...
Table of contents
- Preface
- Configuring Power BI Tools
- Accessing and Retrieving Data
- Building a Power BI Data Model
- Authoring Power BI Reports
- Working in the Service
- Getting Serious with Date Intelligence
- Parameterizing Power BI Solutions
- Implementing Dynamic User-Based Visibility in Power BI
- Applying Advanced Analytics and Custom Visuals
- Administering and Monitoring Power BI
- Enhancing and Optimizing Existing Power BI Solutions
- Deploying and Distributing Power BI Content
- Integrating Power BI with Other Applications
- Other Book You May Enjoy
- Index
Frequently asked questions
Yes, you can cancel anytime from the Subscription tab in your account settings on the Perlego website. Your subscription will stay active until the end of your current billing period. Learn how to cancel your subscription
No, books cannot be downloaded as external files, such as PDFs, for use outside of Perlego. However, you can download books within the Perlego app for offline reading on mobile or tablet. Learn how to download books offline
Perlego offers two plans: Essential and Complete
- Essential is ideal for learners and professionals who enjoy exploring a wide range of subjects. Access the Essential Library with 800,000+ trusted titles and best-sellers across business, personal growth, and the humanities. Includes unlimited reading time and Standard Read Aloud voice.
- Complete: Perfect for advanced learners and researchers needing full, unrestricted access. Unlock 1.5M+ books across hundreds of subjects, including academic and specialized titles. The Complete Plan also includes advanced features like Premium Read Aloud and Research Assistant.
We are an online textbook subscription service, where you can get access to an entire online library for less than the price of a single book per month. With over 1.5 million books across 990+ topics, we’ve got you covered! Learn about our mission
Look out for the read-aloud symbol on your next book to see if you can listen to it. The read-aloud tool reads text aloud for you, highlighting the text as it is being read. You can pause it, speed it up and slow it down. Learn more about Read Aloud
Yes! You can use the Perlego app on both iOS and Android devices to read anytime, anywhere — even offline. Perfect for commutes or when you’re on the go.
Please note we cannot support devices running on iOS 13 and Android 7 or earlier. Learn more about using the app
Please note we cannot support devices running on iOS 13 and Android 7 or earlier. Learn more about using the app
Yes, you can access Microsoft Power BI Cookbook by Greg Deckler,Brett Powell in PDF and/or ePUB format, as well as other popular books in Computer Science & Business Intelligence. We have over 1.5 million books available in our catalogue for you to explore.