Learn how to make optimum use of your BIM data using Dynamo to make better design decisions and create feature-rich dashboards using Power BI to track your model's dataKey Features• A go-to guide for AEC professionals to analyze and manage their data• Explore popular use cases and best practices from experts around the world• Create efficient dashboards using Dynamo and Power BIBook DescriptionBusiness intelligence software has rapidly spread its roots in the AEC industry during the last few years. This has happened due to the presence of rich digital data in BIM models whose datasets can be gathered, organized, and visualized through software such as Autodesk Dynamo BIM and Power BI.Managing and Visualizing Your BIM Data helps you understand and implement computer science fundamentals to better absorb the process of creating Dynamo scripts and visualizing the collected data on powerful dashboards. This book provides a hands-on approach and associated methodologies that will have you productive and up and running in no time. After understanding the theoretical aspects of computer science and related topics, you will focus on Autodesk Dynamo to develop scripts to manage data. Later, the book demonstrates four case studies from AEC experts across the world. In this section, you'll learn how to get started with Autodesk Dynamo to gather data from a Revit model and create a simple C# plugin for Revit to stream data on Power BI directly. As you progress, you'll explore how to create dynamic Power BI dashboards using Revit floor plans and make a Power BI dashboard to track model issues.By the end of this book, you'll have learned how to develop a script to gather a model's data and visualize datasets in Power BI easily.What you will learn• Understand why businesses across the world are moving toward data-driven models• Build a data bridge between BIM models and web-based dashboards• Get to grips with Autodesk Dynamo with the help of multiple step-by-step exercises• Focus on data gathering workflows with Dynamo• Connect Power BI to different datasets• Get hands-on experience in data management, analysis, and visualization techniques with guidance from experts across the worldWho this book is forThis book is for BIM managers, BIM coordinators, design technology managers, and all AEC professionals who want to learn Autodesk Dynamo to analyze, manage, and visualize their BIM data as well as understand some associated computer science topics. You need to have a background in BIM and knowledge of what a BIM model is to make the most of this book.
eBook - ePub
Managing and Visualizing Your BIM Data
- 436 pages
- English
- ePUB (mobile friendly)
- Available on iOS & Android
eBook - ePub
Managing and Visualizing Your BIM Data
About this book
Trusted by 375,005 students
Access to over 1.5 million titles for a fair monthly price.
Study more efficiently using our study tools.
Information
Topic
InformatiqueSubtopic
Business IntelligenceSection 1: Overview of Digitalization and BIM Data
In this part of the book, you will develop a good overview of what is happening in relation to digitization in general and why analyzing BIM data is so important. The first three chapters will explain background IT subjects that are fundamental in terms of reaching the book's goal: managing and visualizing BIM data. For example, we will learn how series of ones and zeros create digital content on the screens of our devices, along with how much digital data we produce every day, what types of digital data there are, and how our job falls inside the category of hybrid jobs. These are just some of the subjects we will cover during the first three chapters.
This section comprises the following chapters:
- Chapter 1, Introducing Units of Digital Information
- Chapter 2, Understanding Data Centers
- Chapter 3, Warming Up Your Data Visualization Engines
Chapter 1: Introducing Units of Digital Information
Welcome to the world of BIM data and digitalization!
Before we start digging into the core of digitalization in the Architecture, Engineering, Construction (AEC) industry, BIM data visualization, or management with Autodesk Dynamo and its business intelligence tools, I would like you to know why every business on earth is becoming a data-driven business. If you look around, every type of company, small or large, non-profit or governmental, is walking through a digital transformation, implementing and applying ones and zeros to every process they can. However, in the end, all that matters for company owners is that their company has to adapt to the new business model. It will take time for all of us to go fully digital, but we all will, whether it takes 10 months or 10 years; we are all already in that queue.
Even though this book's aim is to give you some knowledge on BIM data visualization and management, in the first chapter, we will start talking about data. Though we will set BIM aside for now, we will return to it later on, once we get more comfortable with digitalization and basic computer science concepts. We are going to learn about the events that started our digital era, and how modern devices use binary code to represent things such as pictures and videos. Then we will talk about types of digital data and about all of the data that surrounds us, all the time, everywhere (that's why they call it big data, right?!). Finally, we will explore so-called hybrid jobs.
But don't worry, I won't go too much into technical details, although we will cover some technical notions when it comes to Dynamo, data manipulation, and databases. So, get a cup of coffee and if you can, get an Italian one (even better if it's Neapolitan), and meet me in the first chapter!
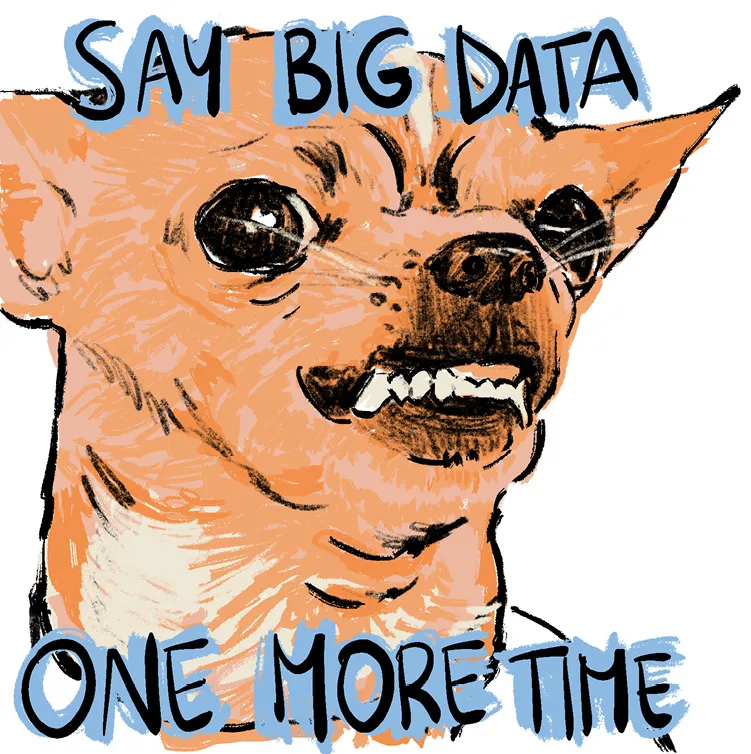
Figure 1.1 – Say "big data" one more time meme!
In this chapter, we will cover the following topics:
- Exploring the beginning of the digitization era
- Learning how simple digital data is
- Getting to know types of digital data
- Understanding how much data we produce
- Learning about hybrid jobs
Exploring the beginning of the digitization era
Lots of companies across the globe started the digital transformation process around the 1950s, when Dr Presper Eckert and Dr John Mauchly invented the UNIVAC, the Universal Automatic Computer, after receiving funds from the Census Bureau. This computer was the first commercial computer for business and government applications! The real leap, though, when things started to become super-duper serious, was in the 1990s, due to the diffusion of the world wide web. If you think about it, ever since then, shopping, banking, working, health, education, and so on, changed forever!
I remember when I was a kid at the end of 1990s; during weekends, my family and I used to go to the shops. There, like everyone else, me, my twin brother, my sister, and our parents bought new clothes, groceries, or new games for the PC (which was my and my dad's favorite!). At that time, no one thought that one day you would be able to buy groceries using your PC or your smartphone. For example, while I'm writing this book, my partner and I are also moving to a new house and have bought a new sofa and a few other pieces of furniture online.
In the following graph, you can have a look at the growth, from 1996, of two of the biggest e-commerce companies – Amazon and eBay:

Figure 1.2 – Growth of Amazon and eBay online shopping from 1996 to 2019
The important thing here that I would like you to understand is that since the 1990s (more or less), the impact of digitalization has been huge for every field, not only for e-commerce. Things such as paper and photographs have been transformed into binary code, the ones and the zeros of computer storage.
Let me ask you this question: Why is data so valuable?
The short answer is that, today, data is profitable. Google and Facebook, for example, built an empire by collecting and analyzing people's data, and today, advertisement companies can even predict what you'll buy tomorrow, literally. When I'm talking to friends and colleagues about this subject, I like to ask them a question, so I want to do the same with you: Do you remember what you were doing or searching on the internet in May 2009, for example? No? Well, Google does. The data we provide to those companies is so vast that they found a new name for it: big data!
But to better understand this sea of data, to use that information to upgrade a company process or find possible mistakes, or even predict something somehow, companies needed to turn it from raw data into well-organized information. And once they did that, they could give advertisers, for example, a set of tools to target their potential customers with astonishing precision. At this point, with all of the data turned into useful information, they needed to build something technologically advanced to analyze and categorize everything deeply, and use that information to make future predictions. That's where Artificial Intelligence (AI) comes to the stage. To give you an example, let's look at the social media platform Facebook. Instead of merely offering advertisers the ability to target their users using data such as demographics, gender, or consumer preferences, they instead provided the ability to target them based on what they will think, how they will behave, and what they will buy. Facebook, back in 2016, revealed an AI engine with self-improving capabilities that could predict all of those things!
And as insane and frightening and unique as it may sound, this is not the only prediction engine out there. In my opinion, I hope that governments will better regulate those systems because they raise more and more questions every day, especially ethically speaking. Think, for example, about Cambridge Analytica, the Facebook scandal of early 2018. Without going into too many details, Cambridge Analytica was implicated in a massive data breach. They used almost 90 million people's private data without their consent. That's massive. And the final goal was to create customized and targeted ads to address your vote for the upcoming political election. Again, like everything else, AI can help our society in many ways, but this is a clear example of how dangerous those systems may be in the wrong hands.
In this section, we just scratched the surface, introducing the events that started the digital era. Coming up, we will cover quite a curious subject: how digital content comes to life on the screens of our devices, starting from a series of ones and zeros.
Learning how simple digital data is
My life and your life are full of data. When you commute to work, for example, you could be scrolling through Twitter, looking at friend's pictures on their social networks, buying groceries from your favorite online store, or streaming music. Everything represented by computers is made of ones and zeros; it is that simple. But how is that possible? How did pictures, videos, and songs start from a simple series of ones and zeros?
Although the answer could be a lot more complex and technical, we will stick to the basics to understand the general concepts. Essentially, to do that, we need to learn things from the point of view of a computer, something that you use all of the time and probably take for granted. This concept is essential to understand when it comes to learning computer science theory. Each one or zero stated in a single switch is called a bit, the smallest piece of data a computer can st...
Table of contents
- Managing and Visualizing Your BIM Data
- Contributors
- Preface
- Section 1: Overview of Digitalization and BIM Data
- Chapter 1: Introducing Units of Digital Information
- Chapter 2: Understanding Data Centers
- Chapter 3: Warming Up Your Data Visualization Engines
- Section 2: Examples and Case Studies from Experts around the World
- Chapter 4: Building a Data Bridge between BIM Models and Web-Based Dashboards
- Chapter 5: Getting Started with Autodesk Dynamo and Data Gathering
- Chapter 6: Importing Revit Plans in Power BI Using Shape Files
- Chapter 7: Creating a Revit Model-Check Dashboard Using Dynamo and Power BI
- Section 3: Deep Dive into Autodesk Dynamo
- Chapter 8: Deep Dive into Dynamo Data Types
- Chapter 9: Using Dynamo to Place Family Instances
- Chapter 10: Gathering a Revit Model's Data from Multiple Models at Once
- Chapter 11: Visualizing Data from Multiple Models in Power BI
- Chapter 12: Having Fun with Power BI
- Other Books You May Enjoy
Frequently asked questions
Yes, you can cancel anytime from the Subscription tab in your account settings on the Perlego website. Your subscription will stay active until the end of your current billing period. Learn how to cancel your subscription
No, books cannot be downloaded as external files, such as PDFs, for use outside of Perlego. However, you can download books within the Perlego app for offline reading on mobile or tablet. Learn how to download books offline
Perlego offers two plans: Essential and Complete
- Essential is ideal for learners and professionals who enjoy exploring a wide range of subjects. Access the Essential Library with 800,000+ trusted titles and best-sellers across business, personal growth, and the humanities. Includes unlimited reading time and Standard Read Aloud voice.
- Complete: Perfect for advanced learners and researchers needing full, unrestricted access. Unlock 1.5M+ books across hundreds of subjects, including academic and specialized titles. The Complete Plan also includes advanced features like Premium Read Aloud and Research Assistant.
We are an online textbook subscription service, where you can get access to an entire online library for less than the price of a single book per month. With over 1.5 million books across 990+ topics, we’ve got you covered! Learn about our mission
Look out for the read-aloud symbol on your next book to see if you can listen to it. The read-aloud tool reads text aloud for you, highlighting the text as it is being read. You can pause it, speed it up and slow it down. Learn more about Read Aloud
Yes! You can use the Perlego app on both iOS and Android devices to read anytime, anywhere — even offline. Perfect for commutes or when you’re on the go.
Please note we cannot support devices running on iOS 13 and Android 7 or earlier. Learn more about using the app
Please note we cannot support devices running on iOS 13 and Android 7 or earlier. Learn more about using the app
Yes, you can access Managing and Visualizing Your BIM Data by Ernesto Pellegrino,Manuel Andre Bottiglieri,Gavin Crump,Luisa Cypriano Pieper,Dounia Touil in PDF and/or ePUB format, as well as other popular books in Informatique & Business Intelligence. We have over 1.5 million books available in our catalogue for you to explore.