- 928 pages
- English
- ePUB (mobile friendly)
- Available on iOS & Android
eBook - ePub
The Handbook of Surface Imaging and Visualization
About this book
This exciting new handbook investigates the characterization of surfaces. It emphasizes experimental techniques for imaging of solid surfaces and theoretical strategies for visualization of surfaces, areas in which rapid progress is currently being made. This comprehensive, unique volume is the ideal reference for researchers needing quick access to the latest developments in the field and an excellent introduction to students who want to acquaint themselves with the behavior of electrons, atoms, molecules, and thin-films at surfaces. It's all here, under one cover!
The Handbook of Surface Imaging and Visualization is filled with sixty-four of the most powerful techniques for characterization of surfaces and interfaces in the material sciences, medicine, biology, geology, chemistry, and physics. Each discussion is easy to understand, succinct, yet incredibly informative. Data illustrate present research in each area of study. A wide variety of the latest experimental and theoretical approaches are included with both practical and fundamental objectives in mind. Key references are included for the reader's convenience for locating the most recent and useful work on each topic. Readers are encouraged to contact the authors or consult the references for additional information.
This is the best ready reference available today. It is a perfect source book or supplemental text on the subject.
Trusted by 375,005 students
Access to over 1.5 million titles for a fair monthly price.
Study more efficiently using our study tools.
Information
Chapter 1
Angle-Resolved Auger Electron Spectroscopy
Douglas G. Frank
1. INTRODUCTION
1.1 Auger Electron Emission from Solid Surfaces
1.2 The Auger Phenomenon
1.3 Angle-Resolved Auger Electron Measurements
2. EXPERIMENTAL CONSIDERATIONS
2.1 Auger Electron KE and the “Secant Effect”
2.2 Incident Radiation
2.3 Angle–Resolving Analyzers
2.4 Auger Signal Detection
3. DATA VISUALIZATION
4. THEORETICAL APPROACHES
4.1 Basic Principles
4.2 Empirical Trends
4.3 Empirical Blocking Model
4.4 Inelastic Scattering
4.5 Elastic Scattering
5. EXAMPLE APPLICATIONS
5.1 Depth Profiling
5.2 Monolayer Structure
5.3 Bilayer Structure
5.4 Single Crystals
5.5 Layered Crystals
ACKNOWLEDGMENTS
REFERENCE
1. INTRODUCTION
1.1 AUGER ELECTRON EMISSION FROM SOLID SURFACES
Auger electrons emitted from atoms located near the surface of a solid are scattered by other nearsurface atoms as they emerge from the solid. Several electron-atom scattering phenomena can occur subsequent to emission, including elastic scattering, interference, and inelastic scattering. The nature of each scattering event, the extent to which each type of scattering occurs, and the way in which the electron propagates through the solid depend upon the characteristics of the Auger electron (such as kinetic energy and phase), the electronic structure of the scattering atoms, and the electron trajectory relative to each scattering atom. Accordingly, angle-resolved measurements of Auger electron emission contain information regarding the geometric and electronic structure of the surface region and the electron-atom scattering processes that occur there. Such information can be invaluable to workers in the field of surface imaging and visualization, who often rely upon complementary information from several techniques to obtain a more complete understanding of the structure and behavior of a given surface.
1.2 THE AUGER PHENOMENON
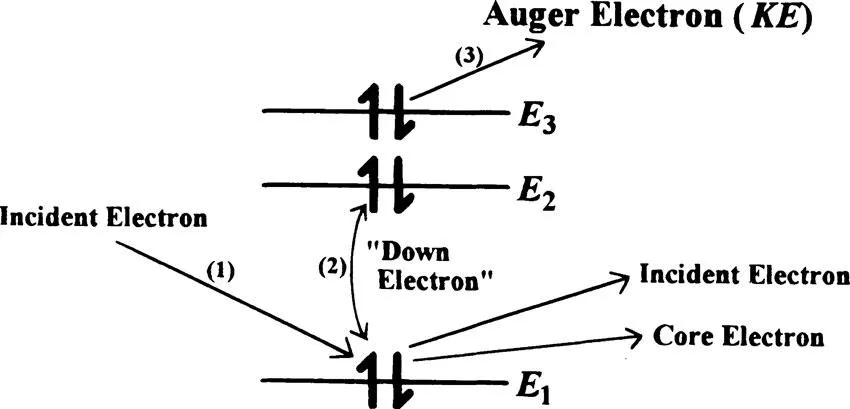
Excitation of an atom, such as by an energetic electron, photon, or ion, can result in the removal of a core electron, followed by a relaxation process in which an outer shell electron fills the core vacancy. The energy released by the relaxation process can be emitted as a photon (usually an X-ray) or via a third electron, known as an “Auger” electron,1 Figure 1.1. The kinetic energy (KE) of the emitted Auger electron is approximately equal to the energy available from the relaxation process (E1 – E2) minus the binding energy of the emitted electron (BE3). Thus, the Auger electron retains information concerning the electronic structure of the emitting atom. All elements emit Auger electrons, except perhaps hydrogen and helium, which have insufficient electrons. In the 0 to 2500 eV KE range, the emission of Auger electrons predominates by approximately two orders of magnitude over the emission of X-rays.2 Auger transitions exhibit relatively large energy bandwidths (often greater than 10 eV) due to the relatively long transition lifetimes (10–15 sec), the participation of multiple electronic levels of slightly different energy, and other final state effects.
Auger electrons were first recognized by Pierre Auger1 in cloud chamber experiments, where he observed such electrons to have discrete energies characteristic of the emitting elements. J. Lander3 was the first to identify the Auger transitions, whose energies and intensities were subsequently tabulated.4 Advances in ultrahigh vacuum (UHV) technique during the 1960s made the development of Auger electron spectroscopy feasible, and L.A. Harris5 was the first to demonstrate that differentiation of the secondary electron energy distribution could be employed with synchronous detection to obtain high contrast spectra. Such measures are necessary because the Auger electrons are typically only a small fraction of the total number of secondary electrons detected at a given KE. Differentiation emphasizes the Auger electron distribution because the energy dependence of the Auger electrons is much sharper than that of the secondary electron background. That is, the Auger electrons are peaked in energy, whereas the secondary emission background usually varies very gradually with KE.
Auger spectroscopy has since found widespread application for elemental analysis and imaging of material surfaces.2 Accordingly, the reader will find several references to Auger electrons throughout this volume, including chapters describing Auger electron spectroscopy itself, scanning Auger microscopy, positron–annihilation–induced Auger electron emission, and an updated tabulation of Auger transitions.
1.3 ANGLE-RESOLVED AUGER ELECTRON MEASUREMENTS
In 1968, while working at General Electric, L. A. Harris6 reported the first experimental studies of the angular variations of Auger emission from a polycrystalline solid. Soon thereafter, K. Siegbahn and co-workers7 reported angular distribution measurements of photoelectrons and Auger electrons emitted from a NaCl single crystal. Both groups reported a large anisotropy in the observed Auger emission versus angle of detection, producing features in the angular profiles that were related to the geometric structure of the surface region. The results clearly showed that Auger electrons that emerge from a solid with kinetic energies in the 0 to 2500 eV range originate primarily from atoms near the surface, due to the high probability that electrons emitted deep within the solid will be inelastically scattered. These earliest reports generated widespread interest in the surface-science community, because they clearly demonstrated that such measurements not only offer a means by which to probe the atomic structure near a solid surface, but also provide an opportunity to explore the fundamental interactions of electrons with matter. In fact, these two aspects of angular dependent measurements constitute the core objectives of what has become a large area of investigation, generally referred to as angle–resolved Auger electron spectroscopy (ARAES).
Subsequent studies of the angular dependence of Auger electron emission from solid surfaces generally attributed the observed anisotropy to two primary phenomena: the intrinsic anisotropy of the emission process itself, and the anisotropy produced by subsequent scattering. In most studies, a small number of angular profiles were measured and then compared with calculated profiles based upon proposed theoretical formalisms. However, limited progress was made due to the difficulty of experimentally isolating the two parts of the phenomenon. This logical dilemma arises because both processes might contribute in varying degrees to the single, final observation. Auger electrons emitted with particular properties due to the electronic environment of the emitting atom can be subsequently scattered, scrambling those initial properties. Alternatively, one may need to know the initial properties of the emitted Auger electron to understand the subsequent scattering events. In mathematical terms, this dilemma is analogous to solving a single equation containing two unknowns. Accordingly, angle-resolved Auger measurements from solid surfaces invariably reflect to some degree the contributions of both effects: (a) the intrinsic properties of the Auger emission, including electron KE and emission anisotropy, and (b) the effect of elastic and inelastic scattering of Auger electrons by other atoms near the surface of the solid.
The possibility of both intrinsic emission and subsequent scattering effects can make...
Table of contents
- Cover
- Title Page
- Copyright Page
- Table of Contents
- Preface
- Contributors
- Chapter 1 Angle-Resolved Auger Electron Spectroscopy
- Chapter 2 Atomic Force Microscopy
- Chapter 3 Auger Electron Spectroscopy
- Chapter 4 Chemical Imaging Using Ion Microscopy
- Chapter 5 Collision-Induced Surface Processes
- Chapter 6 Depth Profiling
- Chapter 7 Electrochemical Epitaxy
- Chapter 8 Electrochemical Nucleation
- Chapter 9 Electrochemical Quartz Crystal Microbalance Studies of Electroactive Surface Films
- Chapter 10 Electron Beam Lithography
- Chapter 11 Electron Microscopy
- Chapter 12 Electron Stimulated Desorption-Ion Angular Distribution (ESDIAD)
- Chapter 13 Field Emission Ion Sources for Focused Ion Beams
- Chapter 14 Field Emission Microscopy
- Chapter 15 Field Ion Microscopy and Spectroscopy
- Chapter 16 Fluid-Fluid Interfaces: Optical Imaging of Capillary Systems
- Chapter 17 Fullerenes Viewed by Scanning Tunneling Microscopy, Photoemission, and Inverse Photoemission
- Chapter 18 High-Resolution Electron Energy Loss Spectroscopy
- Chapter 19 Imaging of Colloidal Particles
- Chapter 20 Infrared Attenuated Total Reflection Spectroscopy of Surface Active Species
- Chapter 21 Infrared Spectroscopy of Surfaces
- Chapter 22 Langmuir-Blodgett Films
- Chapter 23 LEED Pattern Directory
- Chapter 24 Low-Energy Electron Diffraction: Some Basic Conceptual Tools
- Chapter 25 Low-Energy Electron Microscopy
- Chapter 26 Low-Energy Ion Scattering Spectroscopy
- Chapter 27 Magnetism in Low-Dimensional Systems: Magnetic Properties of Thin Films
- Chapter 28 Metal Clusters on Oxides
- Chapter 29 Metal Surface Reconstructions
- Chapter 30 Molecular Beam Epitaxy
- Chapter 31 Molecular Beam Scattering: Diffraction
- Chapter 32 Molecular Beam Scattering: Reactive Scattering
- Chapter 33 Molecular Orbital Theory of Surfaces
- Chapter 34 Molecular Orientation
- Chapter 35 Monitoring Surface Chemistry with Optical Second Harmonic Generation
- Chapter 36 Monolayer Surface Structures
- Chapter 37 Mössbauer Effect Spectroscopy
- Chapter 38 Nuclear Magnetic Resonance
- Chapter 39 Optical Holographic Imaging
- Chapter 40 Optical Imaging of Particles
- Chapter 41 Optically Detected Electron Spin Resonance of Aromatic Ketones Adsorbed on Surfaces
- Chapter 42 Organic Molecular Beam Epitaxy
- Chapter 43 Photoelectron Emission Microscopy
- Chapter 44 Picosecond Luminescence Studies of Recombination Dynamics at GaAs/Electrolyte Interfaces
- Chapter 45 Positron Annihilation Induced Auger Electron Spectroscopy
- Chapter 46 Radiotracer Study of Electrode Surfaces
- Chapter 47 Raman Spectroscopy of Surfaces
- Chapter 48 Scanning Electrochemical Microscopy
- Chapter 49 Scanning Tunneling Microscopy of Electrode Surfaces In Situ
- Chapter 50 Scanning X-Ray Photoelectron Microscopy (SXPEM)
- Chapter 51 Secondary Ion Mass Spectrometry
- Chapter 52 Self-Assembled Monolayers: Models for Organic Surface Chemistry
- Chapter 53 Self-Assembled Monolayers: Models of Organic Interfaces
- Chapter 54 Semiconductor Thin Film Growth Dynamics During Molecular Beam Epitaxy
- Chapter 55 Sum-Frequency Generation Studies of Bonding and Reaction at Interfaces
- Chapter 56 Surface Catalysis on Metals
- Chapter 57 Surface-Enhanced Raman Spectroscopy of Flexible Molecules
- Chapter 58 Surface Forces
- Chapter 59 Thermal Desorption Mass Spectrometry
- Chapter 60 Tunneling Spectroscopy
- Chapter 61 Vibrational Microspectroscopy for the Analysis of Surfaces and Particles on Surfaces
- Chapter 62 X-Ray Photoelectron Diffraction
- Chapter 63 X-Ray Photoelectron Spectroscopy
- Chapter 64 X-Ray Standing Waves on Surfaces
- Index
Frequently asked questions
Yes, you can cancel anytime from the Subscription tab in your account settings on the Perlego website. Your subscription will stay active until the end of your current billing period. Learn how to cancel your subscription
No, books cannot be downloaded as external files, such as PDFs, for use outside of Perlego. However, you can download books within the Perlego app for offline reading on mobile or tablet. Learn how to download books offline
Perlego offers two plans: Essential and Complete
- Essential is ideal for learners and professionals who enjoy exploring a wide range of subjects. Access the Essential Library with 800,000+ trusted titles and best-sellers across business, personal growth, and the humanities. Includes unlimited reading time and Standard Read Aloud voice.
- Complete: Perfect for advanced learners and researchers needing full, unrestricted access. Unlock 1.5M+ books across hundreds of subjects, including academic and specialized titles. The Complete Plan also includes advanced features like Premium Read Aloud and Research Assistant.
We are an online textbook subscription service, where you can get access to an entire online library for less than the price of a single book per month. With over 1.5 million books across 990+ topics, we’ve got you covered! Learn about our mission
Look out for the read-aloud symbol on your next book to see if you can listen to it. The read-aloud tool reads text aloud for you, highlighting the text as it is being read. You can pause it, speed it up and slow it down. Learn more about Read Aloud
Yes! You can use the Perlego app on both iOS and Android devices to read anytime, anywhere — even offline. Perfect for commutes or when you’re on the go.
Please note we cannot support devices running on iOS 13 and Android 7 or earlier. Learn more about using the app
Please note we cannot support devices running on iOS 13 and Android 7 or earlier. Learn more about using the app
Yes, you can access The Handbook of Surface Imaging and Visualization by Arthur T. Hubbard in PDF and/or ePUB format, as well as other popular books in Technology & Engineering & Physical & Theoretical Chemistry. We have over 1.5 million books available in our catalogue for you to explore.