Experimental Design and Statistical Analysis for Pharmacology and the Biomedical Sciences
- English
- ePUB (mobile friendly)
- Available on iOS & Android
Experimental Design and Statistical Analysis for Pharmacology and the Biomedical Sciences
About this book
A practical guide to the use of basic principles of experimental design and statistical analysis in pharmacology
Experimental Design and Statistical Analysis for Pharmacology and the Biomedical Sciences provides clear instructions on applying statistical analysis techniques to pharmacological data. Written by an experimental pharmacologist with decades of experience teaching statistics and designing preclinical experiments, this reader-friendly volume explains the variety of statistical tests that researchers require to analyze data and draw correct conclusions.
Detailed, yet accessible, chapters explain how to determine the appropriate statistical tool for a particular type of data, run the statistical test, and analyze and interpret the results. By first introducing basic principles of experimental design and statistical analysis, the author then guides readers through descriptive and inferential statistics, analysis of variance, correlation and regression analysis, general linear modelling, and more. Lastly, throughout the textbook are numerous examples from molecular, cellular, in vitro, and in vivo pharmacology which highlight the importance of rigorous statistical analysis in real-world pharmacological and biomedical research.
This textbook also:
- Describes the rigorous statistical approach needed for publication in scientific journals
- Covers a wide range of statistical concepts and methods, such as standard normal distribution, data confidence intervals, and post hoc and a priori analysis
- Discusses practical aspects of data collection, identification, and presentation
- Features images of the output from common statistical packages, including GraphPad Prism, Invivo Stat, MiniTab and SPSS
Experimental Design and Statistical Analysis for Pharmacology and the Biomedical Sciences is an invaluable reference and guide for undergraduate and graduate students, post-doctoral researchers, and lecturers in pharmacology and allied subjects in the life sciences.
Tools to learn more effectively

Saving Books

Keyword Search

Annotating Text

Listen to it instead
Information
1
Introduction
Experimental design: the important decision about statistical analysis
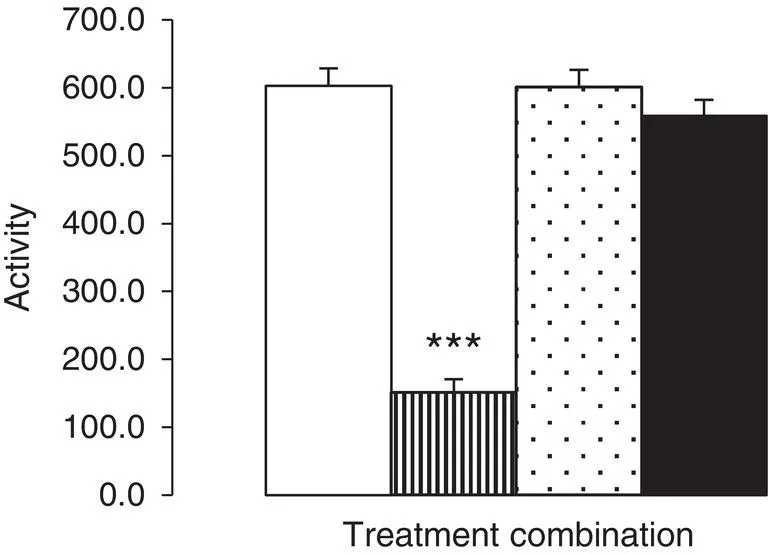
- The step immediately prior to producing such a summary of experimental data is the Inferential Statistical tests employed to analyse the data. In the example provided here, this would be the two‐way ANOVA test followed by a suitable the post hoc test (here the Tukey test was used); why these tests were deemed appropriate will be explained later (see Chapter 17). The statistical test employed, however, is determined by the type and number of data sets produced by the experiment, but may include tests of data distribution and skewness, pairwise comparisons, other models of ANOVA, etc.
- The step immediately prior to the Inferential Statistical analysis is the calculation of the Descriptive Statistics. These are the calculated summary values used to describe the data which are subsequently used to generate the data in the figure (e.g. bar height, etc.). Most experimental data are generally summarised by a measure of central tendency, such as the Mean (of which there are three types – but more about that later), together with the Standard Deviation or Standard Error of the Mean, Median (together with the range or semi‐quartile ranges), or Mode. However, note here that the measure of central tendency you report must be appropriate to the data your experiment has generated (see Chapters 5, 8, and 9).
- The step prior to the statistical procedures is the input of your experimental data into your favourite statistical package. All statistical packages differ slightly from each other, but the most common method is to use a data spreadsheet similar to that seen with Microsoft Excel (see Figure 1.2).
 Figure 1.2 Excel spreadsheet showing original rodent locomotor activity data examining the effect of mesulergine on mCPP‐induced hypolocomotion (see Figure 1.1). The functionality of spreadsheets such as Microsoft Excel allows the calculation of simple Descriptive Statistics such as Mean, Standard Deviation, Standard Error of the Mean. Data on file.
 - Of course, you must generate your data before you are able to input such data into the spreadsheet and to achieve this you must decide on your experimental methodology – the process which generates a series of values which eventually allows you to draw conclusions about your experiment.
- Before you decide on your methodology, however, you must have a working hypothesis which, in turn, is the result of your
- experimental aims that address the
- problem you have identified and is the raison d'etre of the whole experimental design process.
Experimental design process
- What is the problem?
- What is the aim?
- Hypothesis
- Experimental methodology
- Data collection
- Data input
- Descriptive Statistical data
- Inferential Statistical data
- Final output
Table of contents
- Cover
- Table of Contents
- Title Page
- Copyright Page
- Biography
- Acknowledgements
- Foreword
- 1 Introduction
- 2 So, what are data?
- 3 Numbers; counting and measuring, precision, and accuracy
- 4 Data collection: sampling and populations, different types of data, data distributions
- 5 Descriptive statistics; measures to describe and summarise data sets
- 6 Testing for normality and transforming skewed data sets
- 7 The Standard Normal Distribution
- 8 Non‐parametric descriptive statistics
- 9 Summary of descriptive statistics: so, what values may I use to describe my data?
- 10 Introduction to inferential statistics
- 11 Comparing two sets of data – Independent t‐test
- 12 Comparing two sets of data – Paired t‐test
- 13 Comparing two sets of data – independent non‐parametric data
- 14 Comparing two sets of data – paired non‐parametric data
- 15 Parametric one‐way analysis of variance
- 16 Repeated measure analysis of variance
- 17 Complex Analysis of Variance Models
- 18 Non‐parametric ANOVA
- 19 Correlation analysis
- 20 Regression analysis
- 21 Chi‐square analysis
- 22 Confidence intervals
- 23 Permutation test of exact inference
- 24 General Linear Model
- Appendix A: Appendix AData distribution: probability mass function and probability density functions
- Appendix B: Appendix BStandard normal probabilities
- Appendix C: Appendix CCritical values of the t‐distribution
- Appendix D: Appendix DCritical values of the Mann–Whitney U‐statistic
- Appendix E: Appendix ECritical values of the F distribution
- Appendix F: Appendix FCritical values of chi‐square distribution
- Appendix G: Appendix GCritical z values for multiple non‐parametric pairwise comparisons
- Appendix H: Appendix HCritical values of correlation coefficients
- Index
- End User License Agreement
Frequently asked questions
- Essential is ideal for learners and professionals who enjoy exploring a wide range of subjects. Access the Essential Library with 800,000+ trusted titles and best-sellers across business, personal growth, and the humanities. Includes unlimited reading time and Standard Read Aloud voice.
- Complete: Perfect for advanced learners and researchers needing full, unrestricted access. Unlock 1.4M+ books across hundreds of subjects, including academic and specialized titles. The Complete Plan also includes advanced features like Premium Read Aloud and Research Assistant.
Please note we cannot support devices running on iOS 13 and Android 7 or earlier. Learn more about using the app