Make data analysis fast, reliable, and clean with Python, Pandas and Matplotlib.
Key Features ? A detailed walk-through of the Pandas library's features with multiple examples. ? Numerous graphical representations and reporting capabilities using popular Matplotlib. ? A high-level overview of extracting data from including files, databases, and the web.
Description No matter how large or small your dataset is, the author 'Fabio Nelli' simply used this book to teach all the finest technical coaching on applying Pandas to conduct data analysis with zero worries. Both newcomers and seasoned professionals will benefit from this book. It teaches you how to use the pandas library in just one week. Every day of the week, you'll learn and practise the features and data analysis exercises listed below: Day 01: Get familiar with the fundamental data structures of pandas, including Declaration, data upload, indexing, and so on. Day 02: Execute commands and operations related to data selection and extraction, including slicing, sorting, masking, iteration, and query execution. Day 03: Advanced commands and operations such as grouping, multi-indexing, reshaping, cross-tabulations, and aggregations. Day 04: Working with several data frames, including comparison, joins, concatenation, and merges.Day 05: Cleaning, pre-processing, and numerous strategies for data extraction from external files, the web, databases, and other data sources. Day 06: Working with missing data, interpolation, duplicate labels, boolean data types, text data, and time-series datasets. Day 07: Introduction to Jupyter Notebooks, interactive data analysis, and analytical reporting with Matplotlib's stunning graphics.
What you will learn ?Extract, cleanse, and process data from databases, text files, HTML pages, and JSON data. ?Work with DataFrames and Series, and apply functions to scale data manipulations. ?Graph your findings using charts typically used in modern business analytics. ?Learn to use all of the pandas basic and advanced features independently. ? Storing and manipulating labeled/columnar data efficiently.
Who this book is for If you're looking to expedite a data science or sophisticated data analysis project, you've come to the perfect place. Each data analysis topic is covered step-by-step with real-world examples. Python knowledge isn't required however, knowing a little bit helps
Table of Contents 1. Pandas, the Python library 2. Setting up a Data Analysis Environment 3. Day 1 - Data Structures in Pandas library 4. Day 2 - Working within a DataFrame, Basic Functionalities 5. Day 3 - Working within a DataFrame, Advanced Functionalities 6. Day 4 - Working with two or more DataFrames 7. Day 5 - Working with data sources and real-word datasets 8. Day 6 - Troubleshooting Challenges wit Real Datasets 9. Day 7 - Data Visualization and Reporting 10. Conclusion – Moving Beyond
Trusted by 375,005 students
Access to over 1.5 million titles for a fair monthly price.
Before starting to work directly with seven chapters in seven days, it would be beneficial to introduce the Pandas library. In this chapter, you will see how this library developed in Python – one of the most successful programming languages – was born, and then in a few simple words, we will summarize what it is for and what it does.
Pandas is designed specifically for data analysis and is intricately linked to this discipline. So, in this chapter, you will be shown a brief overview of the steps that involve data processing and data analysis in general. These concepts will be resumed in the following chapters with practical examples.
Structure
In this chapter, we will cover the following topics:
A bit of history
Why use Pandas (and Python) for data analysis?
Data analysis
Tabular form of data
Objective
After studying this chapter, you will have an overview of how the Pandas library can serve in data analysis, on what type of data it works (a tabular form of data), and what are its strengths that have made it a great success in these recent years, making it an indispensable tool.
A bit of history
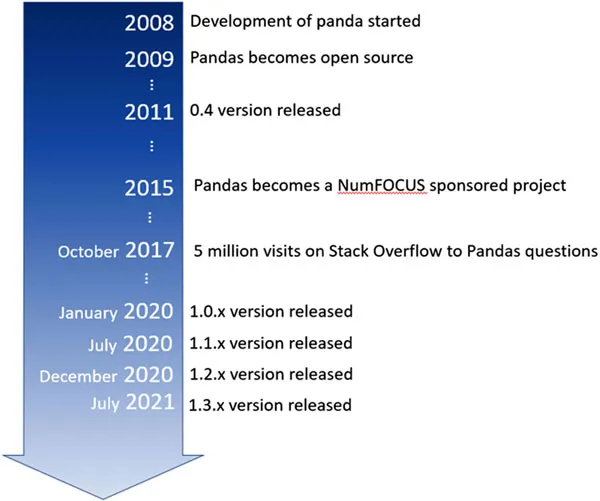
In 2008, developer Wes McKinney, employed at AQR Capital Management (a global investment management company based in Connecticut (USA)), began work on creating a tool that would allow quantitative analysis to be performed on financial data. In those years, there was already an excellent development of projects on R, a programming language designed to carry out statistical analyzes, and many companies made extensive use of the commercial software based on the use of macros or scripting on data spreadsheets (spreadsheets such as Microsoft Excel).
But McKinney was looking for something new. The R language was quite difficult for the layman and took an enormous time to learn. As for the commercial software, these had a cost and were also very limited to their basic functionality. The Python language was emerging in the scientific environment, a very flexible and easy-to-learn programming language. Python was free, easy to learn, and could virtually interface with anything – thanks to the integration of many modules and libraries in continuous development.
Already in 2009, McKinney had in hand a module of functions and new data structures that formed the prototype of a library that would later become Pandas. Before leaving the company he worked for, he managed to convince the management to grant the open-source right to the library. And in 2012, another McKinney colleague at AQR Capital Management joined the project, Chang She, to become the second-largest contributor to the bookstore.
Figure 1.1 shows in sequence, significant events in the history of the Pandas library:
Figure 1.1: Pandas library timeline
Thus, was born the pandas module, a specific Python library for data analysis. The goal was to provide the Python developers with efficient data structures and all the functionality necessary to carry out the data analysis activities with this language in the best possible way.
The choice of using the tabular form as structured data (like spreadsheets) and integrating functionalities similar to those used by the SQL language to manipulate and generate database tables, was the key to the success of this library. Much of the functionality of the R language and macros available in commercial software were implemented in Python and integrated into the pandas library, making it an even more powerful and flexible tool.
The choice to use Python as a programming language allows you to take advantage of many libraries that greatly expand the scope of application of our analysis projects. One of these libraries is for example the NumPy library. This powerful tool for scientific computing, once integrated into the project, allowed the implementation of indexing and element selection tools with high performance, compensating in a good part of the computational speed problems of the Python language compared to other programming languages, such as C and Fortran.
Figure 1.2 shows how choosing a Python library like Pandas allows you to take advantage of many other technologies, such as NumPy:
Figure 1.2: Pandas and other Python libraries for data analysis
In 2017, because of the great diffusion of Python in academic and professional environments, there was a growth of interest in the pandas library and its potential, becoming a reference tool for all those involved in the data analysis sector. Moreover, it was precisely in those years that we began to talk about Data Science almost everywhere.
Taking advantage of the wave of success, pandas have developed enormously in recent years, resulting in the release of numerous versions, thanks to the contribution of more and more developers.
Today, many data scientists in the major private companies that analyze data (Google, Facebook, JP Morgan) use Pandas. This library is, therefore, the perfect tool for data analysis – powerful, flexible, easy to understand, can be integrated with many other libraries, and is, therefore, an indispensable tool to know.
The Pandas library is the free software developed under 3-Clause BSD License, also known as Modified BSD License, and all releases and documentation are freely available and can be consulted on the official website (https://pandas.pydata.org/).
Why use Pandas (and Python) for data analysis?
As shown earlier, the choice of using Python as the programming language for developing Pandas has led to the undisputed success of this library. Since its first appearance in 1991, Python has spread almost exponentially, becoming today one of the most used programming languages. The merit of this is due precisely to the great flexibility of this language and its ability to integrate libraries into its code that have extended its applicability to many areas of work.
In this section, we will see in detail the following factors that led to choosing Pandas and the Python language as a tool for data analysis and data science in general:
A trust gained over the years
A flexible language that adapts to any context
Automation, reproducibility, and interaction
A trust gained over the years
As for data analysis, thanks to the pandas library, Python soon entered into competition with other programming languages and analysis software such as R, Stata, SAS, and MATLAB. Python, however, being a free product, has spread easily, and due to its enormous potential, it has been able to gain wide trust from all the users. Although at first it was seen as a tool for “do-it-yourself” calculation, over the years, Python has proven to guarantee excellent results and be a valid tool in both the academic and the industrial fields. In fact, today Python enjoys the utmost confidence in the world of data science, and this is largely due to libraries such as Pandas, which have guaranteed its feasibility, providing all the necessary tools to carry out a work of analysis and calculation of the highest level, at virtually no cost.
A flexible language that adapts to any context
In many organizations, it is common to find projects or processes in which several programming languages or calculation software are involved at the same time. Since they work strictly in specific fields (sometimes too specific), each of them must be applied only to one or more steps of data processing. But they never manage to cover the entire structure of a project.
Therefore, to start a project, it is necessary to set up a certain number of development and work environments, in addition to developing interfaces or ways of exchanging information and data between them.
But why keep so many works and development environments when just one might be more than enough? It is at this point that Python takes over, a language so flexible that it adapts to many applications and can be used in many areas. In more and more organizations, this language has gradually replaced all pre-existing technologies (web server, calculation, programming, notebooks, algorithms, data visualization tools, and so on) unifying them under a single language.
Automation, reproducibility, and interaction
Pandas is a library based on a programming language. But why not instead choose an application that has already been developed, tested, and therefore, does not require development and programming skills? By choosing Pandas, you will find yourself forced to deal with the programming activities that require time and skills, however simple and intuitive programming in Python can be. So, why choose Pandas?
It is a question of automation, reproducibility, and interaction. Programming languages are gradually replacing large applications that offer everything ready and tested. Applications are environments, even though they are powerful, feature-rich, narrow, and fixed. In fact, they can offer thousands of features, but often never a one that fits your needs completely.
Choosing a programming language, you leave a free hand to those who use it. In this case, the developer or data scientist will choose and develop a work environment that will fully meet their needs. Python provides a large number of libraries, full of ready-made tools, thus, allowing it to work even at a high level, with algorithms and procedures already implemented within. Therefore, the data scientist will be free to use ready-made tools by integrating them into their personal work environment.
Large applications with ready-made work environments require the continuous presence of a user who interacts with them, selecting items, entering values, and performing continuous checks on the results to then choose how to continue the analysis and processing of the data. Pandas, being a library of programming languages, is instead a perfect automation tool. Everything can be automated. Once the procedure is established, you can convert everything into lines of code that can be executed as many times as you want. Furthermore, given that the operations, choices, and data management will be carried out by programs that strictly follow the commands read from lines of code, and not from real-time operations by humans, reproducibility will also be guaranteed.
But why then choose Python and not another programming language like Java or C++?
Python is a language that differs from the latter in that it is an interpreter language. The developed code does not need to be written in the form of complete programs, which then must be compiled to run. The Python code can also run one line at a time and see how the system responds to each of them, and depending on the result, make decisions or modify the following code. You could then interact with the data analysis process. So, the interaction has been added, which is one of the aspects that has made the use of software and applications advantageous compared to programming languages.
Data Analysis
With the previous two sections, you will have become aware of the qualities that make Pandas and Python an indispensable tool for data analysis. The next step is to take a quick look at what the latter is. In the following section, we will have a quick overview of data analysis and some concepts that will then serve to better understand the purpose of many features in the Pandas library.
What is data analysis?
Data analysis can be defined as the disciplinary area in which a series of techniques are applied to collect, handling, and process a series of data. The ultimate goal will be to obtain the necessary information from these data in order to draw conclusions and support decision-making.
Therefore, using calculation techniques and tools, we will start with the raw data extracted from the real world, which will undergo manipulations (cleaning, sorting, processing, statistics, views) in order to gradually convert them into useful information for the purpose set at the beginning of the analysis. The objective of the analysis will, therefore, be to evaluate hypotheses, validating or refuting them (scientific world), or to provide information to be able to make decisions (especially in the business and financial world).
Thus, it is clear that data analysis is a fundamental tool for the academic environment, and more so for the business environment, where making correct decisions can be very important for investments.
The data scientist
Given the importance of data analysis, more elaborate techniques and tools have developed over time, hand-in-hand with the development of information technologies. With the increase in the amount of data available, the use of increasingly powerful and efficient tools becomes indispensable.
Toda...
Table of contents
Cover Page
Title Page
Copyright Page
Dedication Page
About the Author
About the Reviewers
Acknowledgements
Preface
Errata
Table of Contents
1. Pandas, the Python Library
2. Setting up a Data Analysis Environment
3. Day 1 - Data Structures in Pandas library
4. Day 2 - Working within a DataFrame, Basic Functionalities
5. Day 3 - Working within a DataFrame, Advanced Functionalities
6. Day 4 - Working with Two or More DataFrames
7. Day 5 - Working with Data Sources and Real-World Datasets
8. Day 6 - Troubleshooting Challenges with Real Datasets
9. Day 7 – Data Visualization and Reporting
10. Beyond Pandas
Index
Frequently asked questions
Yes, you can cancel anytime from the Subscription tab in your account settings on the Perlego website. Your subscription will stay active until the end of your current billing period. Learn how to cancel your subscription
No, books cannot be downloaded as external files, such as PDFs, for use outside of Perlego. However, you can download books within the Perlego app for offline reading on mobile or tablet. Learn how to download books offline
Perlego offers two plans: Essential and Complete
Essential is ideal for learners and professionals who enjoy exploring a wide range of subjects. Access the Essential Library with 800,000+ trusted titles and best-sellers across business, personal growth, and the humanities. Includes unlimited reading time and Standard Read Aloud voice.
Complete: Perfect for advanced learners and researchers needing full, unrestricted access. Unlock 1.5M+ books across hundreds of subjects, including academic and specialized titles. The Complete Plan also includes advanced features like Premium Read Aloud and Research Assistant.
Both plans are available with monthly, semester, or annual billing cycles.
We are an online textbook subscription service, where you can get access to an entire online library for less than the price of a single book per month. With over 1.5 million books across 990+ topics, we’ve got you covered! Learn about our mission
Look out for the read-aloud symbol on your next book to see if you can listen to it. The read-aloud tool reads text aloud for you, highlighting the text as it is being read. You can pause it, speed it up and slow it down. Learn more about Read Aloud
Yes! You can use the Perlego app on both iOS and Android devices to read anytime, anywhere — even offline. Perfect for commutes or when you’re on the go. Please note we cannot support devices running on iOS 13 and Android 7 or earlier. Learn more about using the app
Yes, you can access Pandas in 7 Days by Fabio Nelli in PDF and/or ePUB format, as well as other popular books in Computer Science & Data Mining. We have over 1.5 million books available in our catalogue for you to explore.