- 42 pages
- English
- ePUB (mobile friendly)
- Available on iOS & Android
eBook - ePub
About this book
The Asia Small and Medium-Sized Enterprise Monitor (ASM) is a knowledge-sharing product developed as a key resource for micro, small, and medium-sized enterprise (MSME) development policies in Asia and the Pacific. The ASM 2021 Volume IV reports on a technical exercise for developing an empirically rigorous index that measures various dimensions affecting MSME development in developing Asia.
Tools to learn more effectively

Saving Books

Keyword Search

Annotating Text

Listen to it instead
Information
Estimation Results
This section presents the estimation results on the regional SME-DI (i) covering all 15 countries, (ii) for Southeast Asia, and (iii) for South Asia; and the country SME-DI for Viet Nam.
1. Regional SME-DI: Overall Estimate
To estimate the regional SME-DI, the probabilistic PCA was applied to the country-level panel data and obtain three factors, principal component (PC)1 to PC3 (Figure 1 and Table 4).
Figure 1: Time Series Plots of Estimated Principal Components—Regional
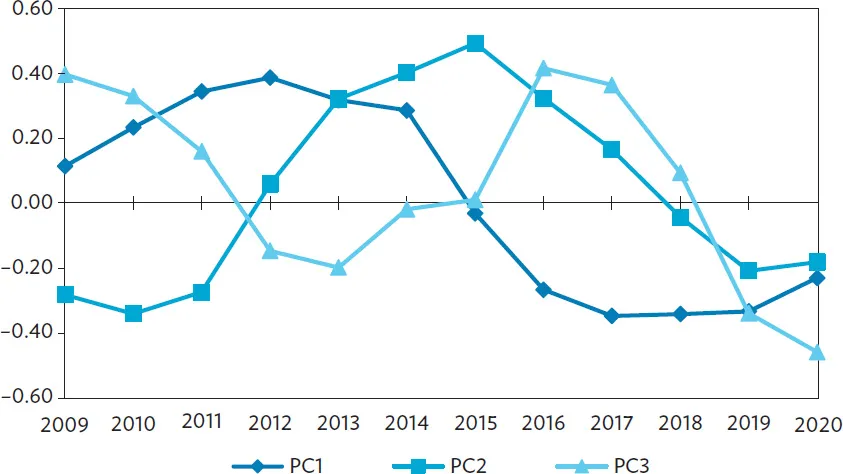
PC = principal component.
Source: Authors’ estimates.
Table 4: Time Series of Estimated Principal Components—Regional
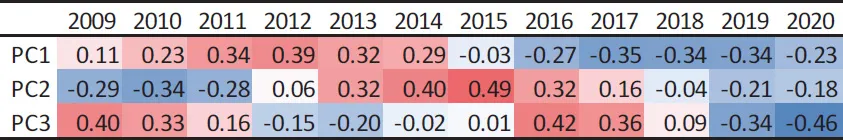
PC = principal component.
Source: Authors’ estimates.
First, the three factors show differing time-series dynamics. For example, PC1 remains high over the first half of the 2009–2014 sample period, which corresponds to the aftermath of the 2008–2009 global financial crisis. It goes down afterward. PC2 reaches its peak in the middle of the sample period while PC3 shows more complex dynamics.
Second, PC1 makes the largest contribution to the variation in country-level panel data (33%), followed by PC2 (22%) and PC3 (13%) (Table 5). Given that more than 50% of the variation is explained by the first two factors, we will focus mainly on those in interpreting the results.
Table 5: Contribution of Each Estimated Principal Component (1)
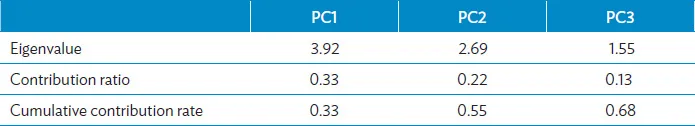
PC = principal component.
Source: Authors’ estimates.
Third, Table 6 lists the loadings of each factor for each variable. We mark the factor loadings with a darker red (blue) color when they are positive and large (negative and small). Given the mechanics of the PCA, each PC has unique patterns of the factor loadings to some extent. To see this more clearly and interpret the implication of each factor, the three columns in Table 7 list the factor loadings sorted in descending order.
Table 6: Factor Loadings Based on Probabilistic PCA—Regional

GDP = gross domestic product, Lao PDR = Lao People’s Democratic Republic, MSMEs = micro, small, and medium-sized enterprises, PCA = principal component analysis.
Source: Authors’ estimates.
Table 7: Descending Order: Factor Loadings Based on Probabilistic PCA—Regional

GDP = gross domestic product, Lao PDR = Lao People’s Democratic Republic, MSMEs = micro, small, and medium-sized enterprises, PCA = principal component analysis.
Source: Authors’ estimates.
By construction, each factor is orthogonal to each other and related to each variable with specific factor loadings (the coefficients associated with the principal components). Examining these, we can interpret the meaning of each factor.
For PC1, we found positive and large factor loadings for variables such as bank nonperforming loans (NPLs) by MSMEs and nonbank NPLs in countries such as Pakistan (bank NPLs=6.52), Malaysia (bank NPLs=5.63), the Philippines (bank NPLs=2.83), and Brunei Darussalam (nonbank NPLs=2.21). Although we simultaneously found negative factor loadings for PC1 for bank NPLs by MSMEs, for example, in Singapore (bank NPLs=–1.79), they are relatively small in absolute value. The results indicate that PC1 mainly accounts for the negative impact associated with the status of corporate financing in the Asian region covering 15 countries. PC1 reached its peak in 2012 and kept positive factor loadings until 2014, while negative factor loadings were identified after 2015 through 2020. This suggests the GFC hurt MSME development until 2014 with increasing nonperforming MSME loans, but MSME loan asset quality gradually improved after 2015 and remained that way through end-2020.
Although absolute values are not necessarily large, we also found that PC1 has negative and small factor loadings associated with the number of MSMEs in Indonesia (–1.83), Myanmar (–1.78), Thailand (–1.72), and Nepal (–1.67). This result shows that PC1 also accounts for the small presence of MSME activities right after the GFC and during its recovery.
As for PC2, it had positive and large factor loadings for market capitalization in the Lao PDR (3.87), Pakistan (3.26), Thailand (2.89), Sri Lanka (1.98), and Singapore (1.80). These results show that PC2 largely accounts for the recovery in capital markets after the GFC. Data in the Lao PDR, Pakistan, and Sri Lanka used the stock exchange main board data, while those in Thailand and Singapore used data on emerging markets available to MSMEs (mai and Catalist, respectively). Pakistan introduced its Growth Enterprise Market in 2019 to serve growth-oriented firms, including MSMEs, with reduced listing requirements. Sri Lanka launched its Empower Board under the Colombo Stock Exchange in 2018, as a sponsor-driven equity market dedicated to small businesses. However, there were no market data available as of the end of 2021.
Somewhat logically, PC2 also had negative and small factor loadings for bank NPLs in Malaysia (–3.37), the Philippines (–2.03), Thailand (–1.75), and for nonbank NPLs in Myanmar (–1.91) and Viet Nam (–1.71). Given that PC2 reached its peak from 2013 to 2015, the recovery of corporate finance, exemplified by smaller defaults in specific countries, was successfully captured by PC2.
As mentioned, PC3 shows relatively complicated dynamics. This is consistent with the fact that PC3 was positively linked to various variables ranging from bank loans for MSMEs in Pakistan (4.31) to market capitalization in Pakistan (1.86), India (1.79), and Nepal (1.66), and are negatively linked to nonbank NPLs in Viet Nam (–2.04), Brunei Darussalam (–1.96), and Myanmar (–1.66) as well as bank NPLs by MSMEs in the Philippines (–2.62). These results indicated PC3 accounts for the recovery in some countries’ capital markets and in corporate financing.
We should highlight that these results are obtained from the probabilistic PCA. This means that even when some records in specific data series are missing, we can still obtain reliable PCs. From a practical point of view, this resilience against missing data is highly attractive.
2. Regional SME-DI: Southeast Asia
This subsection describes what occurred in S...
Table of contents
- Front Cover
- Title Page
- Copyright Page
- Contents
- Tables and Figures
- Foreword
- Acknowledgments
- Abbreviations
- Executive Summary
- Introduction
- Lessons from the 2020 SME-DI Exercise
- Another Trial: How to Cope with the Data Limitation
- Dataset
- Estimation Results
- Conclusion
- Appendixes
- References
- Footnotes
- Back Cover
Frequently asked questions
Yes, you can cancel anytime from the Subscription tab in your account settings on the Perlego website. Your subscription will stay active until the end of your current billing period. Learn how to cancel your subscription
No, books cannot be downloaded as external files, such as PDFs, for use outside of Perlego. However, you can download books within the Perlego app for offline reading on mobile or tablet. Learn how to download books offline
Perlego offers two plans: Essential and Complete
- Essential is ideal for learners and professionals who enjoy exploring a wide range of subjects. Access the Essential Library with 800,000+ trusted titles and best-sellers across business, personal growth, and the humanities. Includes unlimited reading time and Standard Read Aloud voice.
- Complete: Perfect for advanced learners and researchers needing full, unrestricted access. Unlock 1.4M+ books across hundreds of subjects, including academic and specialized titles. The Complete Plan also includes advanced features like Premium Read Aloud and Research Assistant.
We are an online textbook subscription service, where you can get access to an entire online library for less than the price of a single book per month. With over 1 million books across 990+ topics, we’ve got you covered! Learn about our mission
Look out for the read-aloud symbol on your next book to see if you can listen to it. The read-aloud tool reads text aloud for you, highlighting the text as it is being read. You can pause it, speed it up and slow it down. Learn more about Read Aloud
Yes! You can use the Perlego app on both iOS and Android devices to read anytime, anywhere — even offline. Perfect for commutes or when you’re on the go.
Please note we cannot support devices running on iOS 13 and Android 7 or earlier. Learn more about using the app
Please note we cannot support devices running on iOS 13 and Android 7 or earlier. Learn more about using the app
Yes, you can access Asia Small and Medium-Sized Enterprise Monitor 2021 Volume IV by in PDF and/or ePUB format, as well as other popular books in Economics & Economic Policy. We have over one million books available in our catalogue for you to explore.