eBook - ePub
Regression Analysis
Understanding and Building Business and Economic Models Using Excel
- 190 pages
- English
- ePUB (mobile friendly)
- Available on iOS & Android
eBook - ePub
Regression Analysis
Understanding and Building Business and Economic Models Using Excel
About this book
The technique of regression analysis is used so often in business and economics today that an understanding of its use is necessary for almost everyone engaged in the field. This book will teach you the essential elements of building and understanding regression models in a business/economic context in an intuitive manner. The authors take a non-theoretical treatment that is accessible even if you have a limited statistical background. It is specifically designed to teach the correct use of regression, while advising you of its limitations and teaching about common pitfalls. This book describes exactly how regression models are developed and evaluated —where real data is used, instead of contrived textbook-like problems. Completing this book will allow you to understand and build basic business/economic models using regression analysis. You will be able to interpret the output of those models and you will be able to evaluate the models for accuracy and shortcomings. Even if you never build a model yourself, at some point in your career it is likely that you will find it necessary to interpret one; this book will make that possible. Included are instructions for using Microsoft Excel to build business/economic models using regression analysis with an appendix using screen shots and step-by-step instructions.
Trusted by 375,005 students
Access to over 1.5 million titles for a fair monthly price.
Study more efficiently using our study tools.
Information
Chapter 1
Background Issues for Regression Analysis
Chapter 1 Preview
When you have completed reading this chapter you will:
• Realize that this is a practical guide to regression not a theoretical discussion.
• Know what is meant by cross-sectional data.
• Know what is meant by time-series data.
• Know to look for trend and seasonality in time-series data.
• Know about the three data sets that are used mostly for examples in the book.
• Know how to differentiate between nominal, ordinal, interval, and ratio data.
• Know that you should use interval or ratio data when doing regression.
• Know how to access the “Data Analysis” functionality in Excel.
Introduction
The importance of the use of regression models in modern business and economic analysis can hardly be overstated. In this book, you will see exactly how such models can be developed. When you have completed the book you will understand how to construct, interpret, and evaluate regression models. You will be able to implement what you have learned by using “Data Analysis” in Excel to build basic mathematical models of business and economic relationships.
You will not know everything there is to know about regression; however, you will have a thorough understanding about what is possible and what to look for in evaluating regression models. You may not ever actually build such a model in your own work but it is very likely that you will, at some point in your career, be exposed to such models and be expected to understand models that someone else has developed.
Initial Data Issues
Before beginning to look at the process of building and evaluating regression models, first note that nearly all of the data used in the examples are real data, not data that have been contrived to show some purely academic point. The data used are the kind of data one is faced with in the real world. Data that are used in business applications of regression analysis are either cross-sectional data or time-series data. We will use examples of both types throughout the text.
Cross-sectional Data
Cross-sectional data are data that are collected across different observational units but in the same time period for each observation. For example, we might do a customer (or employee) satisfaction study in which we survey a group of people all at the same time (e.g., in the same month).
A cross-sectional data set that you will see in this book is one for which we gathered data about college basketball teams. In this data set, we have many variables concerning 82 college basketball teams all for the same season. The goal is to try to model what influences the conference winning percent age (WP) for such a team. You might think of this as a “production function” in which you want to know what factors will help produce a winning team.
Each of the teams represents one observation. For each observation, we have a number of potential variables that might influence (in a causal manner) a team’s winning percent in their conference games. In Figure 1.1, you see a graph of the data for the 82 teams in the sample. These teams came from seven major sport conferences: ACC, Big 12, Big East, Big 10, Mountain West, PAC 10, and SEC.
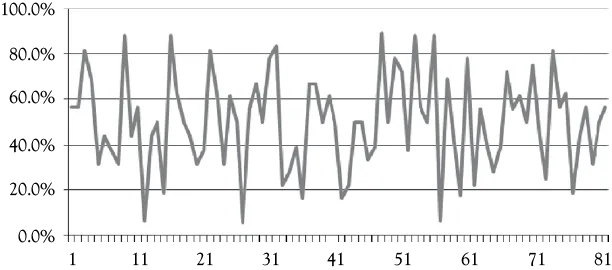
Figure 1.1. The conference winning percent age for 82 basketball teams: An example of cross-sectional data. Source: Statsheet at http://statsheet.com/mcb.
Time-series Data
Time-series data are data that are collected over time for some particular variable. For example, you might look at the level of unemployment by year, by quarter, or by month. In this book, you will see examples that use two primary sets of time-series data. These are women’s clothing sales in the United States and the occupancy for a hotel.
A graph of the women’s clothing sales is shown in Figure 1.2. When you look at a time-series graph, you should try to see whether you observe a trend (either up or down) in the series and whether there appears to be a regular seasonal pattern to the data. Much of the data that we deal with in business has either a trend or seasonality or both and knowing this can be helpful in determining potential causal variables to consider when building a regression model.
The other time-series you frequently will use in examples is shown in Figure 1.3. This series represents the number of rooms occupied per month in a large independent motel. During the time period being considered, there was a considerable expansion in the number of casinos in the State, most of which had integrated lodging facilities. As you can see in Figure 1.3, there is a downward trend in occupancy. The owners wanted to evaluate the causes for the decline. These data are proprietary so the numbers are somewhat disguised as is the name of the hotel. But the data represent real business data and a real business problem.
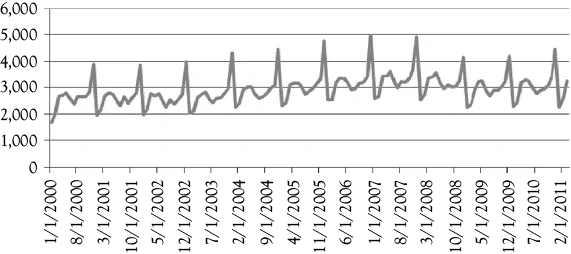
Figure 1.2. Women’s clothing sales (monthly) in the united states in millions of dollars: an example of time-series data. Source: www.economagic.com.
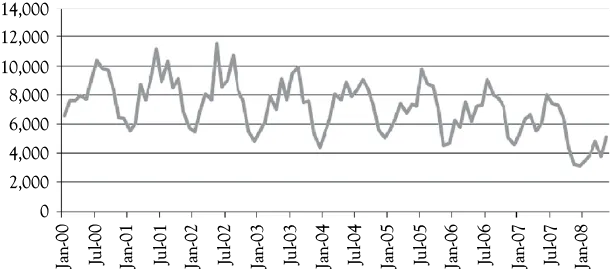
Figure 1.3. Stoke’s lodge occupancy per month: a second example of time-series data. Source: Proprietary.
To help you understand regression analysis, these three sets of data have been discussed repeatedly throughout the book. Also, in chapter 10, you will see a complete example of model building for quarterly Ambercrombie & Fitch sales (time-series data). These examples will help you understand how to build regression models and how to evaluate the results without confusing with too many different situations.
An Additional Data Issue
Not all data are appropriate for use in building regression models. This means that before doing the statistical work of developing a regression model you must first consider what types of data you have. One way data are often classified is to use a hierarchy of four data types. These are: nominal, ordinal, interval, and ratio. In doing regression analysis, the data that you use should be composed of either interval or ratio numbers.1 A short description of each will help you recognize when you have appropriate (interval or ratio) data for a regression model.
Nominal Data
Nominal data are numbers that simply represent a characteristic. The value of the number has no other meaning. Suppose, for example, that your company sells a product on four continents. You might code these continents as: 1 = Asia, 2 = Europe, 3 = North America, and 4 = South America. The numbers 1 through 4 simply represent regions of the world. Numbers could be assigned to continents in any manner. Some one else might have used different coding, such as: 1 = North America, 2 = Asia, 3 = South America, and 4 = Europe. Notice that arithmetic operations would be meaningless with these data. What would 1 + 2 mean? Certainly not 3! That is, Asia + Europe does not equal North America (based on the first coding above). And what would the average mean? Nothing, right? If the average value for the continents was 2.47 that number would be totally meaningless. With the exception of “dummy variables,” never use nominal data in regression analysis. You will learn about dummy variables in chapter 8.
Ordinal Data
Ordinal data also represent characteristics, but now the va...
Table of contents
- Cover
- Title
- Copyright
- Abstract
- Keywords
- Contents
- Chapter 1 Background Issues for Regression Analysis
- Chapter 2 Introduction to Regression Analysis
- Chapter 3 The Ordinary Least Squares (OLS) Regression Model
- Chapter 4 Evaluation of Ordinary Least Squares (OLS)Regression Models
- Chapter 5 Point and Interval Estimates From a Regression Model
- Chapter 6 Multiple Linear Regression
- Chapter 7 A Market Share Multiple Regression Model
- Chapter 8 Qualitative Events and Seasonality in Multiple Regression Models
- Chapter 9 Nonlinear Regression Models
- Chapter 10 Abercrombie & Fitch Co.—Regression Case Study
- Chapter 11 The Formal Ordinary Least Squares (OLS) Regression Model
- Appendix Some Statistical Background
- Index
Frequently asked questions
Yes, you can cancel anytime from the Subscription tab in your account settings on the Perlego website. Your subscription will stay active until the end of your current billing period. Learn how to cancel your subscription
No, books cannot be downloaded as external files, such as PDFs, for use outside of Perlego. However, you can download books within the Perlego app for offline reading on mobile or tablet. Learn how to download books offline
Perlego offers two plans: Essential and Complete
- Essential is ideal for learners and professionals who enjoy exploring a wide range of subjects. Access the Essential Library with 800,000+ trusted titles and best-sellers across business, personal growth, and the humanities. Includes unlimited reading time and Standard Read Aloud voice.
- Complete: Perfect for advanced learners and researchers needing full, unrestricted access. Unlock 1.5M+ books across hundreds of subjects, including academic and specialized titles. The Complete Plan also includes advanced features like Premium Read Aloud and Research Assistant.
We are an online textbook subscription service, where you can get access to an entire online library for less than the price of a single book per month. With over 1.5 million books across 990+ topics, we’ve got you covered! Learn about our mission
Look out for the read-aloud symbol on your next book to see if you can listen to it. The read-aloud tool reads text aloud for you, highlighting the text as it is being read. You can pause it, speed it up and slow it down. Learn more about Read Aloud
Yes! You can use the Perlego app on both iOS and Android devices to read anytime, anywhere — even offline. Perfect for commutes or when you’re on the go.
Please note we cannot support devices running on iOS 13 and Android 7 or earlier. Learn more about using the app
Please note we cannot support devices running on iOS 13 and Android 7 or earlier. Learn more about using the app
Yes, you can access Regression Analysis by J. Holton Wilson in PDF and/or ePUB format, as well as other popular books in Business & Business Mathematics. We have over 1.5 million books available in our catalogue for you to explore.