The role of Aid for Trade (AfT) in promoting the growth and tradability of services is important, given that it is a major catalyst for inclusive economic and structural transformation. This report highlights emerging trends in AfT in the context of evolving trade performance in Asia and the Pacific. In particular, the impact of AfT on trade in services, thereby helping increase economic and job opportunities for women, and the rise of e-commerce. The report ends by considering policy implications of the experiences of geographically-challenged economies of the region along the dimensions of trade costs, AfT, trade in services, and the role of the digital economy.
- 96 pages
- English
- ePUB (mobile friendly)
- Available on iOS & Android
eBook - ePub
About this book
Trusted by 375,005 students
Access to over 1.5 million titles for a fair monthly price.
Study more efficiently using our study tools.
Information
Topic
CommerceSubtopic
Commerce Général1 Regional Trends in Aid for Trade and Trade Costs
Introduction
Aid for Trade (AfT) is an integral part of official development assistance to developing countries, and aims to help maximize the benefits of trade liberalization by improving their trade and productive capacities, infrastructure, and institutions. In Asia and the Pacific,1 AfT disbursements have grown consistently, and amounted to 38.2% of the region’s total $36.3 billion in official development assistance in 2015, significantly higher than the global average. Regional AfT flows have mainly targeted the transport and energy sectors.
Trade growth in Asia and the Pacific, as elsewhere in the world, has slowed since 2012. Regional trade growth by volume, including the developed economies of Australia, Japan, and New Zealand, was 1.7% in 2016, recovering somewhat from 2015, but below the 2.8% growth in 2014. Forecasts for 2017 are mixed, and in its assessment, the World Trade Organization (WTO) warns that good prospects for recovery could be weighed down by increasingly inward-oriented trade policies.2
With an uncertain global economic environment and the slowdown of recent years drawn large on the trade backdrop, the role of AfT acquires even more prominence. Continued progress in lowering trade costs is imperative, especially since regional logistics performance has worsened across all but a few economies in East Asia and Southeast Asia. Indeed, research indicates that global trade would grow 14.5% by volume if all countries raised their trade infrastructure to meet global best practice (World Economic Forum 2013). In outlining regional trends in AfT and trade costs, this chapter sets the context for the rest of the report.
Over the past 50 years, rapid development has transformed Asia and the Pacific. From being the poorest region in the world, developing Asia has surged ahead over a wide range of economic and social indicators. Even so, long-term challenges remain for the region to achieve inclusive and sustainable growth. In this context, AfT’s support of the Sustainable Development Goals, particularly for poverty eradication and gender empowerment by increasing women’s labor force participation and entrepreneurship opportunities, is a focus of the report. Moreover, given that the services sector (which employs 60% of the global workforce) is set to make a bigger contribution to global economic growth—and the slowdown has not hit trade in services as hard as merchandise trade—the report features how AfT can be leveraged to support trade in services. Attention is paid in the final chapter to the landlocked and sealocked economies of the region, which face developmental constraints and high trade costs typical of nations with geographical challenges.
The report also includes analysis of how AfT can increase tradability in the services sector through regulatory reforms and modern trade facilitation solutions such as e-commerce and digital trade. Ultimately, the report aims to highlight lessons that can inform policy prescriptions for Asia and the Pacific and identify key interventions for AfT under the World Trade Organization-led Aid for Trade Initiative (Box 1.1).
Box 1.1: Aid for Trade
The Aid-for-Trade (AfT) Initiative, launched in 2005 and led by the World Trade Organization, supports opening access to markets by helping developing countries “articulate, communicate and mainstream their trade-related objectives and for donors to align with these,” according to the Organisation for Economic Co-operation and Development (OECD).
The OECD manages the Creditor Reporting System (CRS) for monitoring official development assistance. The recorded flows cover a range of economic sectors and AfT that supports development of trade policy, facilitation, and regional and multilateral trade negotiations. The OECD identifies AfT as comprising the following:1
1. Economic Infrastructure (INF): Aid under this category is primarily directed to projects aimed at developing hard and soft infrastructure networks to enable domestic markets connect to the global economy. Sectors include Transport and Storage (210), Communications (220), and Energy Generation and Supply (230).
2. Building Productive Capacity (BPC): Aid under this category is targeted to trade-related development projects geared toward supporting the private sector exploit their comparative advantages and diversify their exports. Sectors include Banking and Financial Services (240), Business and Other Services (250), Agriculture (311), Forestry (312), Fishing (313), Industry (321), Mineral Resources and Mining (322), and Tourism (332).
3. Trade Policy and Regulations and Trade-related Adjustment (TPR) (331): Aid under this category is primarily directed to helping countries develop their trade strategies, negotiate trade agreements, and implement their outcomes, as well as to deal with costs associated with trade liberalization such as tariff reductions, preference erosion, or declining terms of trade. Sectors include Trade Policy and Administrative Management (33110), Trade Facilitation (33120), Regional Trade Agreements (33130), Multilateral Trade Negotiations (33140), Trade-related Adjustment (33150), and Trade Education/Training (33181).
CRS data does not exactly match all of the above AfT categories. Only parts of official development assistance data are reported as aid for building economic infrastructure and for the creation of “productive capacity.” These data are proxies at best and are the closest approximations for aid in trade-related infrastructure and productive capacity building.
1 Numbers in parentheses are sectoral classification numbers according to OECD’s Creditor Reporting System.
1.1 Recent Trends in Asia’s Trade
Data show that trade by both volume and value in Asia and the Pacific (including developed economies) lost momentum since 2012. A slower-than-expected global economic recovery was the main culprit for falling regional trade growth, but structural and policy factors played a role too—including a slowdown in expansion of the global value chain and, in the People’s Republic of China (PRC), a shift from low-cost manufacturing (ADB 2016a). The downturn in commodity prices was seen as the reason for a sharp contraction in the value of merchandise trade in 2015.
The pace of decline in the value of merchandise trade in Asia and the Pacific slowed to 4.4% in 2016 from -10.1% in 2015 (Figure 1.1), as imports shrank at a slower 4.1% clip in 2016, after shrinking 13.1% in 2015. Services trade was less affected, and grew 0.8% in 2016 from a 2% contraction in 2015, helped by a recovery in imports, which grew 2.2% after contracting 1.8% in 2015. However, merchandise and services trade both fall short of their respective 1.5% and 8.8% growth rates in 2014, and still remain below nominal GDP growth.
Figure 1.1: Merchandise and Services Trade Growth and GDP Growth—Asia and the Pacific and World (%, y-o-y)

Source: ADB calculations using data from World Trade Organization. https://www.wto.org/. International Trade Centre Trade Map. http://www.trademap.org (accessed June 2017). International Monetary Fund. World Economic Outlook April 2017 Database. https://www.imf.org. (accessed April 2017).
Growth of trade in services has exceeded that of merchandise since 2013, and its comparative lack of volatility moreover demonstrates the increasing importance of the services sector to the region’s economies. Services trade has grown more rapidly than merchandise trade both as a share of the region’s output, and in Asia and the Pacific’s share of global trade.
Over 2014–2016, the share of merchandise trade to GDP in the region averaged 24.6% (Figure 1.2).3 Across subregions, the Pacific had the highest trade openness and was most dependent on merchandise trade, at 41.1% of GDP. South Asian economies were least dependent, with merchandise trade averaging 9.1% of GDP.4
Figure 1.2: Merchandise and Services Trade-to-GDP (%)
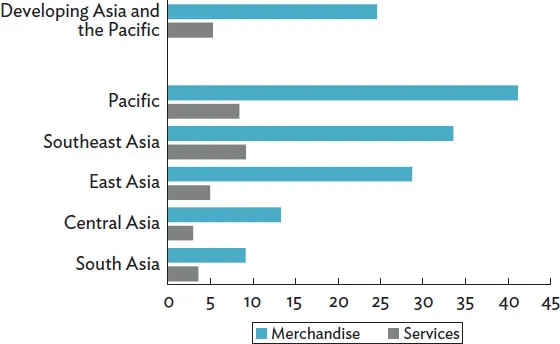
Note: Trade-to-GDP ratios refer to the average of 2014–2016.
Source: ADB calculations using data from World Trade Organization, International Trade Centre Trade Map, International Monetary Fund (accessed June 2017).
On the other hand, services trade accounted for 5.3% of GDP during 2014–2016.5 Southeast Asian economies were most open to trade in services: services exports and imports comprised 9.2% of the subregion’s economy, while Central Asian economies were least reliant, with services trade averaging 2.9% of GDP.6
By value, developing Asia and the Pacific economies made up 29.1% of global merchandise imports and exports during 2014–2016, up from 19% in 2000. East Asian economies, particularly the PRC and Hong Kong, China drove much of the growth (Figure 1.3a). East Asia’s share of global trade rose to 17.1% of imports and 21.3% of exports in 2016, from 11% of imports and 12% of exports in 2000.
Figure 1.3a: Share of Asia and the Pacific in Global Merchandise Imports and Exports, 2000–2016 (%)

Source: ADB calculations using data from World Trade Organization (accessed June 2017).
Meanwhile, the region’s share of global trade in services increased to 22.2% during 2014-2016, from 16.7% in 2005, with East Asia as the major contributor, with 9.1% and 14.7% shares in global exports and imports, respectively, in 2016 (Figure 1.3b). Services trade also gained importance in Southeast Asia.
Figure 1.3b: Share of Asia and the Pacific in Global Services Imports and Exports, 2005–2016 (%)

Source: ADB calculations using data from International Trade Centre Trade Map (accessed June 2017). economies, and the continuing trade slowdown, developing Asian economies must reinvigorate trade growth through measures that reduce costs, improve domestic conditions for business, and strengthen regional connectivity. AfT can continue to play a vital role in each.
Between 2015 and 2016, Asia and the Pacific’s intraregional trade as a share of total trade with the world rose from 56.8% to 57.2%. Intraregional trade has remained above 50% in the last 2 decades, due largely to the rise of regional value chains, as Asian multinationals from emerging economies increasingly relocate parts of the production process to where wages are lower. Greater participation in glo...
Table of contents
- Front Cover
- Title Page
- Copyright Page
- Contents
- Figures, Tables, and Boxes
- Foreword
- Acknowledgments
- Abbreviations
- Highlights
- 1. Regional Trends in Aid for Trade and Trade Costs
- 2. Trade, Inclusive Growth, and Employment for Women
- 3. The Digital Economy and Trade Connectivity
- 4. Aid for Trade and Services
- 5. Promoting Connectivity in Geographically Challenged Economies of Asia and the Pacific
- References
- Back Cover
Frequently asked questions
Yes, you can cancel anytime from the Subscription tab in your account settings on the Perlego website. Your subscription will stay active until the end of your current billing period. Learn how to cancel your subscription
No, books cannot be downloaded as external files, such as PDFs, for use outside of Perlego. However, you can download books within the Perlego app for offline reading on mobile or tablet. Learn how to download books offline
Perlego offers two plans: Essential and Complete
- Essential is ideal for learners and professionals who enjoy exploring a wide range of subjects. Access the Essential Library with 800,000+ trusted titles and best-sellers across business, personal growth, and the humanities. Includes unlimited reading time and Standard Read Aloud voice.
- Complete: Perfect for advanced learners and researchers needing full, unrestricted access. Unlock 1.5M+ books across hundreds of subjects, including academic and specialized titles. The Complete Plan also includes advanced features like Premium Read Aloud and Research Assistant.
We are an online textbook subscription service, where you can get access to an entire online library for less than the price of a single book per month. With over 1.5 million books across 990+ topics, we’ve got you covered! Learn about our mission
Look out for the read-aloud symbol on your next book to see if you can listen to it. The read-aloud tool reads text aloud for you, highlighting the text as it is being read. You can pause it, speed it up and slow it down. Learn more about Read Aloud
Yes! You can use the Perlego app on both iOS and Android devices to read anytime, anywhere — even offline. Perfect for commutes or when you’re on the go.
Please note we cannot support devices running on iOS 13 and Android 7 or earlier. Learn more about using the app
Please note we cannot support devices running on iOS 13 and Android 7 or earlier. Learn more about using the app
Yes, you can access Aid for Trade in Asia and the Pacific by in PDF and/or ePUB format, as well as other popular books in Commerce & Commerce Général. We have over 1.5 million books available in our catalogue for you to explore.