eBook - ePub
Innovative Wastewater Treatment & Resource Recovery Technologies: Impacts on Energy, Economy and Environment
- 690 pages
- English
- ePUB (mobile friendly)
- Available on iOS & Android
eBook - ePub
Innovative Wastewater Treatment & Resource Recovery Technologies: Impacts on Energy, Economy and Environment
About this book
This book introduces the 3R concept applied to wastewater treatment and resource recovery under a double perspective. Firstly, it deals with innovative technologies leading to: Reducing energy requirements, space and impacts; Reusing water and sludge of sufficient quality; and Recovering resources such as energy, nutrients, metals and chemicals, including biopolymers. Besides targeting effective C,N&P removal, other issues such as organic micropollutants, gases and odours emissions are considered. Most of the technologies analysed have been tested at pilot- or at full-scale. Tools and methods for their Economic, Environmental, Legal and Social impact assessment are described.
The 3R concept is also applied to Innovative Processes design, considering different levels of innovation: Retrofitting, where novel units are included in more conventional processes; Re-Thinking, which implies a substantial flowsheet modification; and Re-Imagining, with completely new conceptions. Tools are presented for Modelling, Optimising and Selecting the most suitable plant layout for each particular scenario from a holistic technical, economic and environmental point of view.
Trusted by 375,005 students
Access to over 1.5 million titles for a fair monthly price.
Study more efficiently using our study tools.
Information
Subtopic
Environmental Science© IWA Publishing 2017. Juan M. Lema and Sonia Suarez. Innovative Wastewater Treatment & Resource Recovery Technologies: Impacts on Energy, Economy and Environment. DOI: 10.2166/9781780407876_001
Part 1
Reducing Requirements and Impacts
Part 1a: Reducing Energy Requirements
Chapter 1
Nutrient removal
Francesco Fatone, Juan A. Baeza, Damien Batstone, Grzegorz Cema, Dafne Crutchik, Rubén Díez-Montero, Tim Huelsen, Gerasimos Lyberatos, Andrew McLeod, Anuska Mosquera-Corral, Adrian Oehmen, Elzbieta Plaza, Daniele Renzi, Ana Soares and Iñaki Tejero
1.1 INTRODUCTION
1.1.1 Nutrient management regulation and implications on energy consumptions
After decades from the Urban Wastewater Treatment Directive (271/91/EEC), nutrient pollution resulting from excess nitrogen (N) and phosphorus (P) is still a leading cause of degradation of water quality in Europe (European Commission – JRC, 2014). More stringent nutrient management practices and regulations are therefore needed and have been undertaken. Considering for example the recently identified “ecoregions” in the USA (WERF, 2010), it is clear that current trends are establishing very low standard for in-stream concentrations of N and P which will result in standard for nutrient discharge in sensitive watersheds much lower than 10 mgN/L and 1 mgP/L set by the Directive 271/91/EEC. Technology-based nutrient limits at or near the limit of technology (LOT) are being considered in several regions in the United States and abroad. The LOT for total nitrogen (TN) is typically defined as 3.0 mg/L and total phosphorus (TP) of 0.1 mg/L or the mass-load-based equivalent at the design capacity of the wastewater treatment plant. In some regions, especially sensitive watersheds or ecosystems, TP limits much less than 0.1 mg/L are being considered.
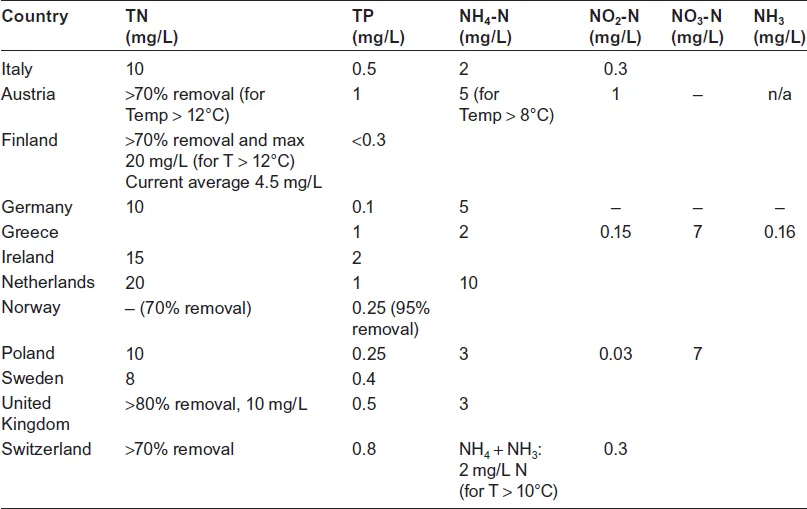
In Europe a recent survey carried out within the Water_2020 network (ES1202 COST Action) concerned the most sensitive areas, where special local nutrient management legislation is applied (Table 1.1). The Water_2020 partners pointed out that the lowest limits on both total nitrogen and phosphorus are set in Finland for the Helsinki Region wastewater treatment plant. Here, the standards of 4.5 mgN/L and 0.3 mgP/L must be achieved to discharge into the eutrophicated Baltic Sea. On the other hand, standard for P discharge in very sensitive watershed are already as low as 0.1 mgP/L and further lowering around Europe is planned.
Table 1.1 Standard for nutrient discharge in sensitive watersheds lower than European legal requirements.
When considering the questions “how low can we go” and “what is stopping us from going lower” (WERF, 2010), we must consider that the nutrient challenge consists in striking the balance between nutrient removal, greenhouse gas emissions, receiving water quality, and costs, so a triple bottom line (TPL) analysis is needed to include environmental, economic, and social pillars (Falk et al. 2013).
To achieve the new, lower effluent limits that are close to the technology-best-achievable performance, facilities have begun to look beyond traditional treatment technologies (U.S. EPA, 2007). Nutrient removal processes could be classified in three “levels” of effluent concentration: i) achievable with conventional nutrient removal technologies (8 mgN/L and 1 mgP/L); ii) enhanced removal requires tertiary treatment and chemical addition to achieve low concentrations (3 mgN/L and 0.1 mgP/L); iii) requires state-of-the-art technology and enhanced/optimized treatment operation, especially to simultaneously achieve both the very low N and P levels (1 mgN/L and 0.01 mgP/L).
The more is the nutrient removal technology complexity, the more is the energy consumption and the Greenhouse gas (GHG) emissions, which largest contributors were found to be energy related (Falk et al. 2013) (Table 1.2).
Table 1.2 Energy consumptions and GHG emissions estimated by Falk et al. (2013) for a treated flowrate of 40000 m3/d municipal wastewater.
| TN Limit (mgN/L) | TP Limit (mgP/L) | Specific Consumption kWh/m3 (Increase %) | GHG Emissions (tonCO2/year) |
| >10 | >1 | 0.14 (baseline) | 4590 |
| 8 | 1 | 0.17 (+20%) | 5570 |
| 8 | 0.1–0.3 | 0.18 (+27%) | 6600 |
| 2 | 0.1 | 0.20 (+41%) | 7570 |
| <2 | <0.02 | 0.38 (+169%) | 12950 |
Therefore, energy efficiency in nutrient removal in wastewater treatment plants (WWTPs) is clearly one of the key pillar to consider for the water-energy-carbon nexus.
1.1.2 Biological Nutrients Removal processes: microbial and energy overview
In recent times, there has been an increased emphasis on increasing the efficiency of BNR processes and reducing the operational costs. One means of improving the cost-effectiveness is by employing short-cut nitrogen removal, or nitrogen removal via the nitrite pathway (Table 1.3). This involves aerobic nitritation by AOBs coupled with anoxic denitritation by denitrifiers, thus necessitating the limitation of NOB growth and activity. Some WWTP operational conditions are known to favour AOB at the expense of NOB, such as the higher growth rate of AOB at temperatures higher than 25°C (Hellinga et al. 1998), as well as the lower affinity of NOB for oxygen, where a low dissolved oxygen (DO) concentration will favour nitrite accumulation instead of nitrate. Short-cut nitrogen removal reduces the oxygen demand of the WWTP by 25% through eliminating the need to oxidise nitrite to nitrate, while simultaneously reducing the COD needed for denitrification by 40% through eliminating the need to reduced nitrate to nitrite. Aeration is widely considered to be one of the main energetic costs associated with WWTP operation, while the external dosing of COD sources also increases costs due to the expense associated with the COD supply as well as the increased sludge production, where sludge processing and disposal also represents one of the main operational costs associated with WWTPs.
Table 1.3 Comparison of the conventional BNR with the advanced BNR processes.
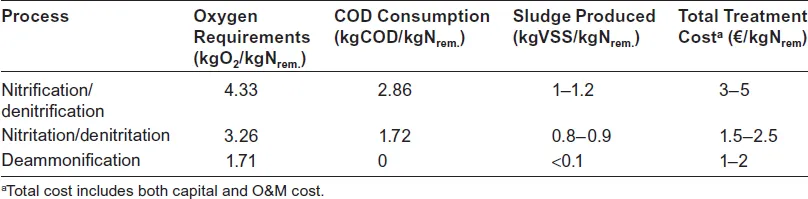
In Table 1.3, a comparison is made between the biomass production, COD and oxygen requirements associated with wastewater treatment plant processes performing COD, N and P removal, as well as their respective nitrogen and phosphorus removal levels (standardized per mg of nitrogen removed). It is clear from Table 1.3 the savings in COD and oxygen requirements as well as the reduced sludge production achievable through short-cut nitrogen removal as compared to conventional nitrification/denitrification.
The anaerobic ammonia oxidation (Anammox) process has also attract...
Table of contents
- Cover
- Half Title
- Title Page
- Copyright Page
- Contents
- List of contributors
- About the editors
- Preface
- Part 1: Reducing Requirements and Impacts
- Part 2: Re-using Water and Sludge
- Part 3: Recovering Resource: Energy and Chemicals
- Part 4: Economic, Environmental, Legal and Social Impacts
- Part 5: Conceiving, Comparing and Selecting Efficient Processes
- Annex 1: E-course: Micropollutants in water
- Annex 2: Implementing an ecoefficiency tool for the holistic design and assessment of the water cycle
- Annex 3: NOVEDAR_EDSS: Intelligent/expert screening of process technologies
- Index
Frequently asked questions
Yes, you can cancel anytime from the Subscription tab in your account settings on the Perlego website. Your subscription will stay active until the end of your current billing period. Learn how to cancel your subscription
No, books cannot be downloaded as external files, such as PDFs, for use outside of Perlego. However, you can download books within the Perlego app for offline reading on mobile or tablet. Learn how to download books offline
Perlego offers two plans: Essential and Complete
- Essential is ideal for learners and professionals who enjoy exploring a wide range of subjects. Access the Essential Library with 800,000+ trusted titles and best-sellers across business, personal growth, and the humanities. Includes unlimited reading time and Standard Read Aloud voice.
- Complete: Perfect for advanced learners and researchers needing full, unrestricted access. Unlock 1.5M+ books across hundreds of subjects, including academic and specialized titles. The Complete Plan also includes advanced features like Premium Read Aloud and Research Assistant.
We are an online textbook subscription service, where you can get access to an entire online library for less than the price of a single book per month. With over 1.5 million books across 990+ topics, we’ve got you covered! Learn about our mission
Look out for the read-aloud symbol on your next book to see if you can listen to it. The read-aloud tool reads text aloud for you, highlighting the text as it is being read. You can pause it, speed it up and slow it down. Learn more about Read Aloud
Yes! You can use the Perlego app on both iOS and Android devices to read anytime, anywhere — even offline. Perfect for commutes or when you’re on the go.
Please note we cannot support devices running on iOS 13 and Android 7 or earlier. Learn more about using the app
Please note we cannot support devices running on iOS 13 and Android 7 or earlier. Learn more about using the app
Yes, you can access Innovative Wastewater Treatment & Resource Recovery Technologies: Impacts on Energy, Economy and Environment by Juan M. Lema,Sonia Suarez Martinez in PDF and/or ePUB format, as well as other popular books in Technology & Engineering & Environmental Science. We have over 1.5 million books available in our catalogue for you to explore.