1 Why has China’s economy grown so fast?1
A successful catch-up paradigm of modernization
In the world as a whole, modernization of all countries is a process of mutual association, mutual competition and mutual development. Many countries, though they started late, have caught up with or surpassed the countries that have led the modernization process.
In terms of modernization, there are countries that lead and countries that lag behind, countries that are advanced and countries that are backward, countries that are catching up and countries that are left behind. In terms of technology, countries may also be divided into innovators and pursuers as well as leaders and imitators. By backwardness, I mean a kind of relative state of being behind others. Countries that are left behind are the countries that are in a state of relative backwardness. A country that is left behind is a country that starts relatively late in launching and entering industrialization rather than a country that is relatively backward in economic development at a certain point of time, as Alexander Gerschenkron puts it.2
The history of modern economic development shows that there have been four successful catch-up paradigms. One is the United States, which spent forty-three years catching up with Britain at the turn of the nineteenth and twentieth centuries. According to data from Angus Maddison, the per capita GDP of the United States in 1820 was only 73.3 percent that of Britain, and reached 75.3 percent in 1870. Starting from 1870, the United States initiated an economic takeoff, registering an average annual per capita GDP growth of 3.9 percent from 1870 to 1913 as opposed to 1.9 percent in Britain over the same period. By 1900, the US average per capita GDP rose to 89.2 percent that of Britain and up to 105.5 percent, surpassing Britain by 1913.3
The second example is the former Soviet Union, which caught up with the United States during the great economic depression. During 1928–1939, the GDP growth rate of the former Soviet Union was 5.6 percent while that of the United States was only 0.8 percent. The per capita GDP of the former Soviet Union was 20.8 percent that of the United States in 1928 and it rose to 34.1 percent by 1939, demonstrating the catch-up effect.
The third example is Japan, which took forty years to catch up with the United States. In 1950, the per capita GDP of Japan was 19.6 percent that of the United States. In 1953, Japan’s GDP growth surpassed the highest level during World War II, starting a takeoff. From 1953 to 1992, Japan’s annual GDP growth averaged 6.5 percent while that of the United States was only 3.0 percent. By 1992, Japan’s per capita GDP amounted to 90.1 percent that of the United States. Japan was regarded as the most successful country in the catchup game and it set a world record (an annual growth rate of 1.95 percent) in increasing the per capita income in 1982–1992 by twenty-eight-fold.
The fourth example is what is known as the “four little dragons” in Asia, which took thirty years to catch up with the developed Western countries. From 1965 to 1992, the GDP of the Republic of Korea (ROK) and Taiwan Region grew at an average annual rate of 8.8 percent. The per capita GDP of ROK and Taiwan was only 24.3 percent and 31.4 percent that of the Western European countries (twelve countries) respectively. But it reached 57.5 percent and 66.6 percent, respectively, by 1992 (see Table 1.1).
Why can latecomers catch up with forerunners? What are the objectives and strategies for the catch-up game? According to Alexander Gerschenkron, backwardness has an advantage in so far as latecomers to industrialization enjoy special benefits and advantages, including the introduction of technologies and equipment from advanced countries. This is the first and foremost factor that can ensure that countries lagging behind in industrialization gain a high-speed growth. The substitution of R&D by technology imports can accelerate the pace of industrialization and avoid risks. In addition, latecomers can learn from the successful experiences of the advanced countries and draw lessons from their setbacks. Latecomers can optimize and diversify the design of their industrialization models innovatively. There is no need for them to repeat the errors experienced by forerunners, such as “pollute first and control later.” They can also choose a faster development path and more open development policies. For instance, economic globalization has provided external conditions for transitional countries in the process of reform to accelerate the development of market mechanisms. An efficient reformer learns faster than others. But how to learn and how to ensure not being left behind depend not only on the initial conditions, but also on the ways of learning.4 Last but not the least is the strong sense of “catch-up.” The more backward the latecomer is, the stronger the desire for catching up and the greater success it will achieve. The tremendous and sudden spurt of a backward country is a “new deal” spiritually.5
Table 1.1 Less advanced countries catch up with advanced ones
According to the new economic growth theories, there are three decisive factors that determine whether or not a poor country can catch up with a rich country. One is the level of savings. The higher the savings rate, the faster the per capita GDP growth rate. The second factor is the opening of the economy. International capital inflow helps accelerate the catch-up process. The third is the speed of technology diffusion. As the cost of imitating and using the technologies and inventions of the forerunners is much lower than the cost of self-innovation, latecomers may overtake technically advanced countries in terms of growth.6 The bigger the gaps in technology between the technology forerunners and technology importers, the greater gains the imported and imitated products will have, thus revealing the catch-up effect. If a technology importing country has a big economy, the gains or overflowing effect of imported technology products will demonstrate the efficiency of a big economy.
China’s economy in retrospective: from decline to rise
China is a typical latecomer in industrialization. It started late in launching industrialization and the time for full industrialization has lagged greatly. If we say that Europe and North America began industrialization from 1750, then China started the process 100 to 200 years later. In other words, the official start of industrialization in China was 1950.
China was not only late in starting industrialization, but it also started at a very low point. The per capita income of Europe and the United States at the time of starting industrialization was much higher than that of China. According to the world economic history expert Angus Maddison (see Table 1.1), the per capita GDP (1990 PPP international dollar) was US $1024 and it rose to US $1232 in 1820. The per capita GDP of the United States was US $600 in 1700 and US $1260 in 1820. But in China, the per capita GDP was only US $439 in 1950, much lower than the level of the United States when it started industrialization in 1820.
At the beginning of the 1950s, the per capita income level of China was much lower than that of industrialized countries in Europe and North America, showing a tremendous development gap. In 1950, the per capita GDP in Western Europe was 10.5 times that of China; the per capita GDP of the United States was 21.8 times that of China; and the per capita GDP of Russia was 6.5 times that of China. Even the per capita GDP of Japan was 4.4 times that of China (see Table 1.2). China’s per capita GDP was also lower than that of India (US $619). China was one of the poorest countries in the world.
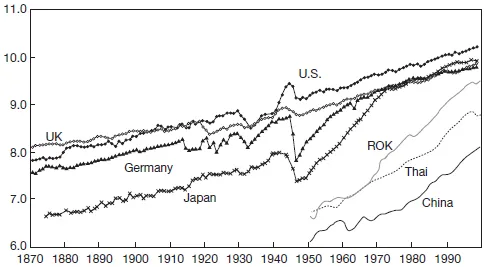
Over the past half century, China’s economy has experienced rapid growth and began to take wing in 1978. The gap between China and the developed countries in terms of average per capita GDP has been greatly narrowed. In 1998, China’s per capita GDP was US $3117. The gap with Western European countries narrowed to 5.8 times, the gap with the United States narrowed to 8.8 times, the gap with Japan narrowed to 6.6 times, and the gap with the world average narrowed to 1.83 times (see Table 1.2). China demonstrates a catchup model in narrowing the gap with developed countries in modernization (see Figure 1.1).
China is one of the countries with the most ancient civilization. Its development history is unique. It has enjoyed long-term prosperity. For a considerably long period of time, China was one of the biggest and the most economically advanced countries in the world. Its position dropped drastically in 1820 and reached its nadir by 1950, but it rose again from 1978.
According to the calculation by Maddison, China’s GDP was one-third (32.9 percent) of the world total in 1820 when it reached its peak.7 It was an economically strong power in the world, followed by India, whose GDP accounted for 16 percent of the world total. France was ranked third, Britain fourth, Germany fifth. But in 1950, the United States ranked first, with its GDP accounting for 27.3 percent, followed by the Soviet Union, Britain, and Germany. China was pushed back to fifth, with its share of GDP in the world total dropping to 4.5 percent. In 1973, the United States and the Soviet Union remained the first two, with Japan ranking third and Germany fourth. China remained fifth. In 1998, the United States stayed in first place while China rose to second, with the share of its GDP in the world total rising to 11.5 percent. Japan was in third place, India fourth, and Germany fifth (see Table 1.3).
Table 1.2 Per capita GDP comparisons among selected economies (1820–1998)
Figure 1.1 Per capita GDP comparisons of major countries (1870–1998)
Source: A. Maddison, Monitoring the World Economy; A. Maddison, The World Economy: A Millennial Perspective, Paris: OECD, 2001, Table B–21.
China was ready for an economic takeoff period at the beginning of the 1980s. From 1978 to 2003, its GDP grew at an average annual rate of 9.3 percent, far higher than the world average. China was one of the fastest growing economies in the world during this period (see Table 1.4). In the 1980s, the world GDP aggregate increased at an average annual rate of 3.3 percent. From 1990 to 2002, it was 2.7 percent. In the same period, China recorded the fastest growth among the world’s major five economies (see Table 1.5). If calculated by PPP, China’s GDP in 2002 was 12 percent of the world total, placing it second, just behind the United States (see Table 1.6).
China’s industrialization process has accelerated to the extent that it has become the biggest country in the world in terms of the output of manufactured goods and added values. The growth of economic aggregate in China is, to a large extent, the result of the rapid growth of industry, particularly the manufacturing industry. From 1978 to 2003, the industrial added value grew at an average annual rate of 11.5 percent, much higher than the world average growth. The world average industrial growth was 3.1 percent in the 1980s and 2.1 percent in 1990–2002. China recorded the fastest industrial growth among the five major powers in terms of production size and added value. Calculated by PPP, China’s industrial added value made up only 3.4 percent of the world total in 1975, but doubled (to 6.8 percent) in 1990 and doubled again in 1995 (to 13.6 percent). By 2002, it already exceeded 20 percent (21.5 percent precisely), when it overtook the United States and ranked first in the world (see Table 1.7).
Table 1.3 Percentage of GDP of major countries in the world total (1820–1998) (%)
Table 1.4 Four fastest developing economies during different periods of time in the world
In a word, the past twenty-five years was a period of tremendous changes in China. It witnessed the fastest economic growth, the accelerated speed of industrialization and urbanization, and the acceleration of world economic globalization. Unprecedented changes also took place in methods of production, ways of living and ways of thinking, a situation that has never been seen for thousands of years.
Table 1.5 Economic growth comparisons of five major countries (1980–2002) (%)
Table 1.6 Comparisons of economic indicators of five major countries (2002)
Sources of China’s economic growth
China entered the economic takeoff stage around 1980 and maintained highspeed growth for a generation. What are the sources of China’s economic growth? What determines and affects China’s economic growth? What are the changes in its growth pattern?
Domestic and foreign studies show that since reform and opening up to the outside world, the key to higher economic growth compared to economic growth prior to reform lies in the surge of total factor productivity (TFP).8 An analysis by the author shows that there were four major sources of economic growth from 1978 to 1995: (1) high-speed growth of labor (2.6 percent); (2) high-speed growth of capital stock (9.3 percent, though a bit lower than the growth rate of 11.5 percent from 1952 to 1978); (3) human capital calculated by the average years of education for employment populations above the age of 15 grew at an average annual rate of 2.2 percent; and (4) TFP rose from –1.9 percent before reform (1952–1978) to 3.3–4.5 percent (calculated by different weights of capital or labor), with contribution to economic growth being 33–47 percent. The results of these calculations are fairly close to the major conclusions of international studies, such as that by the World Bank9 and Maddison.10
Table 1.7 Percentage of industry value added, export trade of five major countries in the world total (1975–2002) (%)
This demonstrates that the high-speed economic growth during reform was not the aftermath of capital growth but because the growth of TFP rose from negative to positive, rising by 5.2–6.5 percent compared with that before reform.
In analyzing the sources of economic growth, we have used another method to construct a growth model. This is a comprehensive growth framework covering capital, labor, institutional change, and knowledge. The per capita GDP is used as the variant of output. Capital is the indicator of per capita capital stock, labor is the employment participation indicator to reflect the impact of population change on labor supply, institution is the institutional accumulation indictors (ten indicators), and knowledge is the knowledge accumulation indicators (ten indicators). For the calculation results, please refer to Table 1.8.
First, about half of the per capita output growth came from per capita capital growth. The per capita growth was 8.5 percent during this period, assuming a fairly high capital deepening process. This reflects the fact that China’s economic growth was capital driven.
Table 1.8 Sources of China per capita output growth (1978–1998)
Secondly, one-third of the per capita output growth came from institutional changes. This reflects the fact that reform has been the engine or driving force of economic growth. The growth of the institutional accumulation indicator during this period was 5.2 percent. This indicates a fairly high speed of institutional changes.
Thirdly, one-fifth of the per capita output growth came from knowledge development. This shows that knowledge development has become a major source of economic growth, though it may not be the major driving force behind China’s economic growth. The knowledge accumulation indicator growth was 3.7 percent during this period. This was a fairly high speed of knowledge innovation, import, absorption, dissemination, and application. It evidently demonstrates the big country effect.
This method of calculation better interprets the sources for China’s economic growth. It implies that institutional changes can be stimulated through reforms, and knowledge development can be promoted through opening up and technical innovation. Thus, policies can be made accordingly to achieve sustainable growth in the future. This means that China should make technology and knowledge, rather than capital and natural resources, the driving forces for economic growth.
However, such high and rapid economic growth and growth of TFP did not last. In 1995–2001, the economic growth rate (8.2 percent) was lower than the long-term potential growth rate (9.3–9.5 percent). And since 1995, the sources for China’s economic growth changed substantially.
First, employment growth dropped significantly (only 1.2 percent). This indicates that the ability of the economy to absorb labor has weakened, leaving China in the state of high economic growth but low employment growth.
Secondly, the capital stock growth rate was 2.5 percentage points higher than that in 1978–1995 and also higher than the growth of 11.5 percent in 1952–1978. Capital productivity (economic growth minus capital growth) turned from positive (0.5 percent) to negative (–3.6 percent). In terms of capital deepening, the per labor capital growth was as high as 10.6 percent, which is the fastest in the world and also the fastest capital deepening process, nearly 4 percentage points higher than in 1978–1995.
Thirdly, the human capital growth rate was as high as 2.8 percent. During this period, more students were enrolled in senior middle schools and institutions of higher learning in China. China has become the country with the largest number of tertiary school students.
Fourthly, TFP dropped significantly to 0.3–2.3 percent (calculated by different weights assigned to capital and labor), dropping by 2–3 percentage points. This shows that the main source for economic growth in 1995–2001 was high capital input, low labor input, and low productivity.
What merits attention is the economic situation in 2003, when GDP growth was 9.1 percent, which is close to the long-term potential growth rate. The investment growth rate was 26.7 percent, much higher than the average growth (10.9 perce...