![]()
1 Overview
1 Introduction
Even with an increasing trend of global foreign direct investment (FDI) flows, regional distribution shows quite different patterns. In particular, there are some views that huge FDI inflows to China since the 1990s might result in produce negative effects on FDI inflows to the Association of South East Asian Nations (ASEAN) area. Thus, the share of the ASEAN as a destination shows a decreasing trend. Even with these various trends of FDI inflows, all countries in the world have endeavored to encourage FDI inflows to their own countries. This is mainly because they expect that FDI inflows promote productivity, employment and exports and therefore contribute to economic growth and development.
Considering the six ASEAN countries (Indonesia, Malaysia, Philippines, Singapore, Thailand, Vietnam) and China, Japan and Korea, this study investigates the various impacts of FDI inflows on labor productivities, employment and exports. Various impacts include own productivity effects, horizontal spillover effects and vertical spillover (forward and backward) effects.
Using firm- or industry-level data depending on availability for each country and using panel or GMM estimation except Singapore, the estimation results recommend various policy suggestions to attract FDI and promote productivity, employment and exports of home countries.
Estimation results are not identical for all countries except for the own-productivity effects. Horizontal spillovers are positive for China, Indonesia, Malaysia, Philippines, Thailand and Vietnam but negative for Japan and Korea. For vertical spillovers, Japan, Korea and Malaysia show negative but China and Thailand show positive backward spillovers. For forward spillovers, Indonesia, Japan and Malaysia show positive effects and China shows negative.
These heterogeneous results might be from different sources of data. However, diverse effects of various spillovers should be considered carefully and be reflected in their own policies to promote FDI inflows.
2 Trends of FDI flows
2.1 General trends of FDI inflows
Global FDI flows tend to show an increasing trend even though this trend was severely affected by the recent economic and financial crisis. Overall FDI inflows were about 0.2, 1.3 and 2.0 trillion US$ in 1990, 2000 and 2007, respectively (UNCTAD, 2009). Inflows fell to 1.7 trillion US$ in 2008 and this was mainly due to the recent worldwide economic crisis.
Measuring the share in worldwide FDI distribution at the cumulative basis, Europe occupies more than a half, 50.7 percent (2007), followed by the United States (24.7 percent), Asia (19.5 percent) and Africa (2.6 percent). The share of Europe has grown significantly after the enlargement of the EU, whereas the share of the United States has been shrinking. The share of Asia also showed a decline in the 2000s but increased again significantly in recent years and reduced the gap between Asia and the United States (UNCTAD online database).
FDI inflows to East Asia (ASEAN-10 countries and South Korea, China and Japan) recorded an average annual increase of 15.3 percent between 1990 and 2007, which was higher than the growth rate (13 percent) in Asia. It also showed a more rapid increase than Europe (14.2 percent) and the United States (11.2 percent).
Regarding the causes of the rapid increase of FDI in East Asia, UNCTAD (2008) pointed out investment activity in developing countries, where the production costs are relatively low, and noted that particularly multinational corporations’ investment and mergers and acquisitions (M&A) activity in Asian countries and investment among regional countries are considered as major influential factors.
East Asia consists of developing countries with relatively low levels of technology, except for regional developed countries such as Korea and Japan, and investments in geographically adjacent developing countries are predominant among the FDI activities of developing countries.
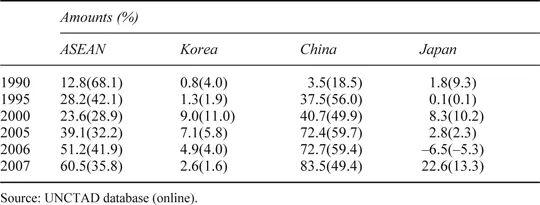
Table 1.1 shows the status of FDI inflows to East Asian countries. In 1990, ASEAN occupied a fairly high proportion of 68.1 percent in FDI to East Asian countries. Since the 1990s, China’s FDI flows have been rapidly increasing, and occupied 56 percent of the East Asian FDI in 1995. As China has appeared as a target destination for FDI, FDI in the neighboring ASEAN in the mid-1990s showed a modest rate of increase. Therefore, the share of the East Asian FDI to ASEAN decreased from 68.1 percent in 1990 to 35.8 percent in 2007.
Korea and Japan constitute relatively low proportions in the East Asian FDI. Korea’s FDI increased up to 9 billion US$ in 2000, but later decreased. It increased again to 9 billion US$ in 2004, but reduced significantly to 2.6 billion US$ in 2007, and its share in the East Asian region reduced to 10.2 billion US$ (1.6 percent), and 12.7 billion US$ was made in Japan in 1999 and 2000, respectively, but later showed an overall decrease and then again increased to 22.6 billion US$ in 2007.
The most attractive countries for FDI in the ASEAN countries are Singapore, Thailand, Malaysia, Indonesia and Vietnam. Singapore appears to occupy the highest proportion of ASEAN FDI inflows: its share of FDI in ASEAN in 2001 reached up to 75.5 percent, and still accounted for a high proportion of 40 percent in 2007. Eventually, in a cumulative measure of amount in FDI, top-ranked countries are China (327.1 billion), Singapore (249.7 billion), Japan (132.9 billion), Korea (119.6 billion), Thailand (85.8 billion), Malaysia (76.8 billion), Indonesia (59 billion), Vietnam (40.2 billion), Philippines (19 billion) in US dollars (UNCTAD online database).
Table 1.1 FDI trends in East Asian countries (flow) (unit: billion US$)
A reason that international investment is activated rapidly in East Asia can be found in the regional production structure. That is, East Asia is the typical region in which the vertical production network becomes deepened by regional investment (Kimura and Ando, 2005; Ando and Kimura, 2007). As shown above, Japan’s regional investment took the lead, but in recent years Korea has also been growing rapidly in the scale of investment, in particular South Korea’s investment that had been focused on China has recently been expanding to the ASEAN countries. Also, Korea and Japan’s regional investment destinations have in the past consisted mainly of particular countries (China, Thailand, Malaysia, Singapore), but recently, the investment in ASEAN developing countries such as Vietnam appears to be increasing, so the complementary relationship between investment and trade in East Asia seems to be intensified further.
2.2 Major investors to ASEAN region
The FDI statistics for any country are available in the UNCTAD World Investment Report, but bilateral direct investment statistics are available only in the Statistical Yearbook by Country. A problem is that there may be a significant statistical difference between two countries, and the criteria of direct investment statistics released by each country in East Asia are also different.1
Table 1.2 shows the trends of the top ten investors to the ASEAN region. For 2006–2008, the EU invested 44 billion US$, which is 23.5 percent of total FDI inflows to the region. The second-highest investor is ASEAN itself, whose share is 15 percent for the same period, followed by Japan (14 percent) and the United States (6.9 percent). The general trend of investors is clearly identified mainly due to a short-term period.
Table 1.2 Top ten sources of FDI inflow to ASEAN (billion US$; share in percent)
Among the East Asian countries, Japan is a leading regional investor, and its share of East Asian investment accounted for only 7 percent of its total overseas investment (flow) in 2000, but increased significantly to 30.5 percent in 2004. However, offshore investment in 2005 grew faster than investment in the East Asia region by recording the proportion declined to 11.6 percent in 2008. In particular, when the global financial crisis occurred in 2008, the amount of Japanese investment in East Asia declined by 0.9 percent compared to the previous year by recording 15.17 billion US$; the reduction in the size of these investments was due to the fact that investments in the ASEAN countries have been shrinking (JETRO online database).
Korea’s investment in the East Asia region in 2008 was no more than 51.3 percent of that of Japan, but its regional share in total overseas investment is higher than Japan’s. South Korea’s major investment destination in East Asia region is China, and the total Korean investment in China has accounted for approximately 50 percent of East Asian investment. In 2005, the share of Korean investment in China reached 75.9 percent of East Asian investment. In recent years, the importance of ASEAN has been highlighted by Korean outward investment. In other words, in the early 2000s Korea’s investment in ASEAN stayed between approximately 0.4 and 0.7 billion US$, but it expanded rapidly up to 1.36 billion US$ in 2006, 100 million US$ in 2007 and 3.16 and 3.54 billion US$ in 2008. Meanwhile, Korean investment in Japan is on a relatively low scale (Korea Exim Bank online database).
2.3 FDI inflows by industry
During the period 1999–2003, the main sector of FDI inflows to ASEAN was manufacturing. Even for Singapore, the share of the manufacturing sector was 34.6 percent. The shares of Thailand and Malaysia were 39.2 percent and 43.7 percent, respectively. However, Indonesia experienced a huge disinvestment, especially in the manufacturing sector. The FDI inflow in the manufacturing sector for 1999–2003 was about –8.2 billion US$. The sectors with positive FDI were primary (agriculture, fisheries and forestry) and financial and service sectors. The authors for Indonesia (Negara and Firdausy, Chapter 2 this volume) explain that, after the 1997 financial crisis, FDI inflows into Indonesia have shifted to the non-tradable sector, specifically the financial intermediation and services sectors.
3 Expected impacts of foreign direct investment
With the rapid expansion of multinational enterprises (MNEs) and FDI in the global economy, the effect of FDI on productivity has become of great interest and has remained a contentious issue. By expecting diverse positive impacts on domestic economy, many countries offer special incentives to foreign enterprises, including lower income taxes or income-tax holidays and import-duty exemptions. The impacts include employment and capital accumulation, own productivity, productivity spillover, backward and forward spillover effects and competition effects.
Table 1.3 FDI inflows by sectors, 1999–2003 (million US$)
3.1 Employment and capital accumulation effect
The main objective of developing countries in attracting FDI is to maximize investment opportunities through capital accumulation inside the country which result in higher employment.
3.2 Own-productivity effect
When MNEs establish their affiliates abroad, they are distinguished from the already-established firms in the host country. Due to the inherent disadvantages such as language, custom, local marketing networks, etc. and higher costs of foreign production, MNEs should possess intangible productive assets to which local firms do not have access, such as technological know-how, marketing and managing skills, export contacts, coordinated relationships with suppliers and customers, reputation, patents, blueprints or trade secrets. Thus the MNEs with the advanced intangible assets have higher productivity that outweighs the disadvantages in the domestic markets of the host countries.
3.3 Horizontal spillover effect
As explained above, the inflows of advanced intangible assets through FDI contribute to the improvement of other domestic companies in the same sector, even though they have no direct FDI flows. Through adopting advanced know-how, domestic companies can improve their productivity, which is called productivity spillover effect or horizontal spillover effect.
3.4 Vertical productivity effect
Some of the productivity spillovers and market-access spillovers from FDI operate via the linkages between the MNE’s foreign affiliate and its local suppliers and customers. Foreign firms may act as a stable source of demand for inputs in an industry, which can benefit upstream domestic firms by allowing them to train and maintain relationships with experienced employees.
The backward-linkage effect arises from cooperation with domestic firms in parts and assembly industries. For example, the MNEs help prospective suppliers to set up production facilities for parts and assemblies or contribute to the production of those local companies through direct usage of those products in the MNEs’ production process. Forward linkage stems from the relationship with upstream industries, customers and the development of local distributors and sales organizations. Both forward and backward effects are called vertical productivity spillover effect.
3.5 Competitive and anti-competitive effects
The MNEs may improve efficiency and resource allocation in the host country by entering monopolistic industries and then by stimulating competition and efficiency. This is called competitive effect. Alternatively, the MNEs may actually oust investment by local companies and market shares and thereby create a more monopolistic industry structure. As a result, foreign entry may lead to a fall in the number of firms in the industry if the least efficient local companies are forced out of business. This is called anti-competitive effect.
4 Overview of empirical results
Most of the countries which intend to induce FDI flows expect a positive impact on their economy as outlined in Section 3. This study consists of the empirical estimation results of nine countries.2 By using firm- or industry-level data depending on availability of data, researchers in those countries undertook empirical studies on the impact of FDI on labor productivity, employment and exports. This study focuses mainly on various linkage effects. In addition to the variables used in traditional analyses, various spillover variables are included in the estimation. They are own-productivity, horizontal productivity spillover effects and vertical (backward- and forward-linkage) spillover effects.
The estimation results and their policy implications are summarized as follows. For clarification, only the results on labor productivity are considered.
4.1 China
FDI does have the horizontal spillover effect on Chinese local enterprises. The models showed that FDI may contribute to promoting the technical management of the whole industry in China. The technical spillover effect from FDI is relatively stronger on private enterprises than on state-owned enterprises. The vertical spillover effect is obviously weaker than its horizontal spillover effect.
Through the estimation results, the authors suggest s...