eBook - ePub
Identifying and Managing Project Risk
Essential Tools for Failure-Proofing Your Project
- 400 pages
- English
- ePUB (mobile friendly)
- Available on iOS & Android
eBook - ePub
About this book
Winner of the Project Management Institute's David I. Cleland Project Management Literature Award 2010 It's no wonder that project managers spend so much time focusing their attention on risk identification. Important projects tend to be time constrained, pose huge technical challenges, and suffer from a lack of adequate resources. Identifying and Managing Project Risk, now updated and consistent with the very latest Project Management Body of Knowledge (PMBOK)® Guide, takes readers through every phase of a project, showing them how to consider the possible risks involved at every point in the process. Drawing on real-world situations and hundreds of examples, the book outlines proven methods, demonstrating key ideas for project risk planning and showing how to use high-level risk assessment tools. Analyzing aspects such as available resources, project scope, and scheduling, this new edition also explores the growing area of Enterprise Risk Management. Comprehensive and completely up-to-date, this book helps readers determine risk factors thoroughly and decisively…before a project gets derailed.
Tools to learn more effectively

Saving Books

Keyword Search

Annotating Text

Listen to it instead
Information
Chapter 1
Why Project Risk Management?
“Those who cannot remember the past
are condemned to repeat it.”
—GEORGE SANTAYANA
are condemned to repeat it.”
—GEORGE SANTAYANA
Far too many technical projects retrace the shortcomings and errors of earlier work. Projects that successfully avoid such pitfalls are often viewed as “lucky,” but there is usually more to it than that.
The Doomed Project
All projects involve risk. There is always at least some level of uncertainty in a project’s outcome, regardless of what the Microsoft Project Gantt chart on the wall seems to imply. High-tech projects are particularly risky, for a number of reasons. First, technical projects are highly varied. These projects have unique aspects and objectives that significantly differ from previous work, and the environment for technical projects evolves quickly. There can be much more difference from one project to the next than in other types of projects. In addition, technical projects are frequently “lean,” challenged to work with inadequate funding, staff, and equipment. To make matters worse, there is a pervasive expectation that however fast the last project may have been, the next one should be even quicker. The number and severity of risks on these technical projects continues to grow. To avoid a project doomed to failure, you must consistently use the best practices available.
Good project practices come from experience. Experience, unfortunately, generally comes from unsuccessful practices and poor project management. We tend to learn what not to do, all too often, by doing it and then suffering the consequences. Experience can be an invaluable resource, even when it is not your own. The foundation of this book is the experiences of others—a large collection of mostly plausible ideas that did not work out as hoped.
Projects that succeed generally do so because their leaders do two things well. First, leaders recognize that much of the work on any project, even a high-tech project, is not new. For this work, the notes, records, and lessons learned on earlier projects can be a road map for identifying, and in many cases avoiding, many potential problems. Second, they plan project work thoroughly, especially the portions that require innovation, to understand the challenges ahead and to anticipate many of the risks.
Effective project risk management relies on both of these ideas. By looking backward, past failures may be avoided, and by looking forward through project planning, many future problems can be minimized or eliminated.
Risk
In projects, a risk can be almost any uncertain event associated with the work. There are many ways to characterize risk. One of the simplest, from the insurance industry, is:
“Loss” multiplied by “Likelihood”
Risk is the product of these two factors: the expected consequences of the event and the probability that the event might occur. All risks have these two related, but distinctly different, components. Employing this concept, risk may be characterized in aggregate for a large population of events (“macro-risk”), or it may be considered on an event-by-event basis (“micro-risk”).
Both characterizations are useful for risk management, but which of these is most applicable differs depending on the situation. In most fields, risk is primarily managed in the aggregate, in the “macro” sense. As examples, insurance companies sell a large number of policies, commercial banks make many loans, gambling casinos and lotteries attract crowds of players, and managers of mutual funds hold large portfolios of investments. The literature of risk management for these fields (which is extensive) tends to focus on large-scale risk management, with secondary treatment for managing single-event risks.
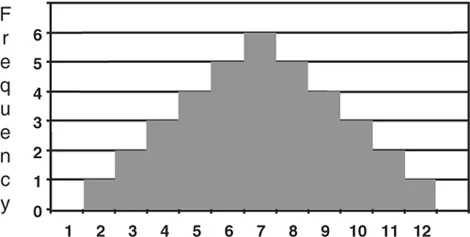
To take a simple example, consider throwing two fair, six-sided dice. In advance, the outcome of the event is unknown, but through analysis, experimenting, or guessing, you can develop some expectations. The only possible outcomes for the sum of the faces of the two dice are the integers between two and twelve. One way to establish expectations is to figure out the number of possible ways there are to reach each of these totals. (For example, the total 4 can occur three ways from two dice: 1 + 3, 2 + 2, and 3 + 1.) Arranging this analysis in a histogram results in Figure 1-1. Because each of the 36 possible combinations is equally likely, this histogram can be used to predict the relative probability for each possible total. Using this model, you can predict the average sum over many tosses to be seven.
If you throw many dice, the empirical data collected (which is another method for establishing the probabilities) will generally resemble the theoretical histogram, but because the events are random it is extraordinarily unlikely that your experiments rolling dice will ever precisely match the theory. What will emerge, though, is that the average sum generated in large populations (one hundred or more throws) will be close to the calculated average of seven, and the shape of the histogram will also resemble the predicted theoretical distribution. Risk analysis in the macro sense takes notice of the population mean of seven, and casino games of chance played with dice are designed by “the house” to exploit this fact. On the other hand, risk in the micro sense, noting the range of possible outcomes, dominates the analysis for the casino visitors, who may play such games only once; the risk associated with a single event—their next throw of the dice—is what matters to them.
Figure 1-1. Histogram of sums from two dice.
For projects, risk management in the large sense is useful to the organization, where many projects are undertaken. But from the perspective of the leader of a single project, there is only the one project. Risk management for the enterprise, or for a portfolio of projects, is mostly about risk in the aggregate (a topic explored in Chapter 13). Project risk management focuses primarily on risk in the small sense, and this is the dominant topic of this book.
Macro-Risk Management
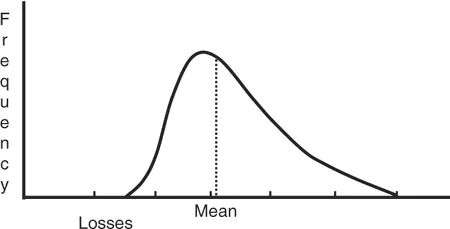
In the literature of the insurance and finance industries, risk is described and managed using statistical tools: data collection, sampling, and data analysis. In these fields, a large population of individual examples is collected and aggregated, and statistics for the “loss and likelihood” can be calculated. Even though the individual cases in the population may vary widely, the average “loss times likelihood” tends to be fairly predictable and stable over time. When large numbers of data points from the population at various levels of loss have been collected, the population can be characterized using distributions and histograms, similar to the plot in Figure 1-2. In this case, each “loss” result that falls into a defined range is counted, and the number of observations in each range is plotted against the ranges to show a histogram of the overall results.
Various statistics and methods are used to study such populations, but the population mean is the main measure for risk in such a population. The mean represents the typical loss—the total of all the losses divided by the number of data points. The uncertainty, or the amount of spread for the data on each side of the mean, also matters, but the mean sufficiently characterizes the population for most decisions.
Figure 1-2. Histogram of population data.
In fields such as these, risk is mostly managed in the macro sense, using a large population to forecast the mean. This information may be used to set interest rates for loans, premiums for insurance policies, and expectations for stock portfolios. Because there are many loans, investments, and insurance policies, the overall expectations depend on the average result. It does not matter so much how large or small the extremes are; as long as the average results remain consistent with the business objectives, risk is managed by allowing the high and low values to balance each other, providing a stable and predictable overall result.
Project risk management in this macro sense is common at the project portfolio and enterprise levels. If all the projects undertaken are considered together, performance primarily depends on the results of the “average” project. Some projects will fail and others may achieve spectacular results, but the aggregate performance is what matters to the business bottom line.
Micro-Risk Management
Passive measurement, even in the fields that manage risk using large populations, is never the whole job. Studying averages is necessary, but it is never sufficient. Managing risk also involves taking action to influence the outcomes.
In the world of gambling, which is filled with students of risk on both sides of the table, knowing the odds in each game is a good starting point. Both parties also know that if they can shift the odds, they will be more successful. Casinos shift the game in roulette by adding zeros to the wheel, but not including them in the calculation of the payoffs. In casino games using cards such as blackjack, casino owners employ the dealers, knowing that the dealer has a statistical advantage. In blackjack the players may also shift the odds, by paying attention and counting the cards, but establishments minimize this advantage through frequent shuffling of the decks and barring known card counters from play. There are even more effective methods for shifting the odds in games of chance, but most are not legal; tactics like stacking decks of cards and loading dice are frowned upon. Fortunately, in project risk management, shifting the odds is not only completely fair, it is an excellent idea.
Managing risk in this small sense considers each case separately—every investment in a portfolio, each individual bank loan, each insurance policy, and in the case of projects, every exposure faced by the current project. In all of these cases, standards and criteria are used to minimize the possibility of large individual variances above the mean, and actions are taken to move the expected result. Screening criteria are applied at the bank to avoid making loans to borrowers who appear to be poor credit risks. (Disregarding these standards by offering “subprime” mortgages has recently led to the well-publicized consequences of deviating from this policy.) Insurers either raise the price of coverage or they refuse to sell insurance to people who seem statistically more likely to generate claims. Insurance firms also use tactics aimed at reducing the frequency or severity of the events, such as auto safety campaigns. Managers of mutual funds work to influence the boards of directors of companies whose stocks are held by the fund. All these tactics work to shift the odds—actively managing risk in the small sense.
For projects, risk management is almost entirely similar to these examples, considering each project individually. Thorough screening of projects at the overall business level attempts to select only the best opportunities. It would be excellent risk management to pick out and terminate (or avoid altogether) the projects that will ultimately fail—if only it were that easy. As David Packard noted, “Half the projects at Hewlett-Packard are a waste of time. If I knew which half, I would cancel them.”
Project risk management—risk management in the small sense—works to improve the chances for each individual project. The leader of a project has no large population, only the single project; there will be only one outcome. In most other fields, risk management is primarily concerned with the mean values of large numbers of independent events. For project risk management, however, what generally matters most is predictability—managing the variation expected in the result for this project.
For a given project, you can never know the precise outcome in advance, but through review of data from earlier work and project planning, you can predict the range and frequency of potential outcomes that you can expect. Through analysis and planning, you can better understand the odds and take action to improve them. The goals of risk management for a single project are to establish a credible plan consistent with business objectives and then to minimize the range of possible outcomes.
One type of “loss” for a project may be measured in time. The distributions in Figure 1-3 compare timing expectations graphically for two similar projects. These plots are different from what was shown in Figure 1-2. In that case, the plot was based on empirical measurements of a large number of actual, historical cases. The plots in Figure 1-3 are projections of what might happen for these two projects, based on assumptions and data for each. These histograms are speculative and require you to pretend that you will execute the project many times, with varying results. Developing this sort of risk characterization for projects is explored in Chapter 9, where quantifying and analyzing project risk is discussed. For the present, assume that the two projects have expectations as displayed in the two distributions.
Figure 1-3. Possible outcomes for two projects.
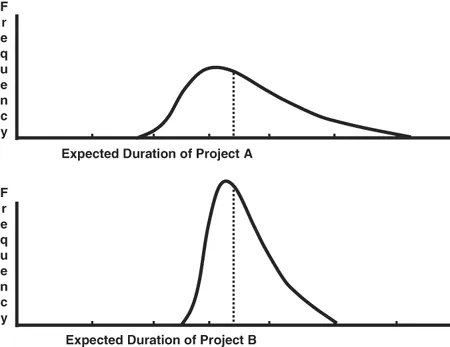
For these two projects, the average (or mean) duration is the same, but the range of expected durations for Project A is much larger. Project B has a much narrower spread (the statistical variance, or standard deviation), and so it will be more likely to complete close to the expected duration. The larger range of possible durations for Project A represents higher risk, even though it also includes a small possibility of an outcome even shorter than expected for Project B. Project risk increases with the level of uncertainty, both negative and positive.
Project risk management uses the two fundamental parameters of risk—likelihood and loss—just as any other area of risk management does. Likelihood is generally characterized as “probability” and may be estimated in several ways for project events (though often by guessing, so it can be quite imprecise). Loss is generally referred to for projects as “impact,” and it is based on the consequences to the project if the risk does occur. Impact is us...
Table of contents
- Cover Page
- Title Page
- Copyright Page
- Contents
- Acknowledgments
- Chapter 1: Why Project Risk Management?
- Chapter 2: Planning for Risk Management
- Chapter 3: Identifying Project Scope Risk
- Chapter 4: Identifying Project Schedule Risk
- Chapter 5: Identifying Project Resource Risk
- Chapter 6: Managing Project Constraints and Documenting Risks
- Chapter 7: Quantifying and Analyzing Activity Risks
- Chapter 8: Managing Activity Risks
- Chapter 9: Quantifying and Analyzing Project Risk
- Chapter 10: Managing Project Risk
- Chapter 11: Monitoring and Controlling Risky Projects
- Chapter 12: Closing Projects
- Chapter 13: Program, Portfolio, and Enterprise Risk Management
- Chapter 14: Conclusion
- Appendix
- Index
Frequently asked questions
Yes, you can cancel anytime from the Subscription tab in your account settings on the Perlego website. Your subscription will stay active until the end of your current billing period. Learn how to cancel your subscription
No, books cannot be downloaded as external files, such as PDFs, for use outside of Perlego. However, you can download books within the Perlego app for offline reading on mobile or tablet. Learn how to download books offline
Perlego offers two plans: Essential and Complete
- Essential is ideal for learners and professionals who enjoy exploring a wide range of subjects. Access the Essential Library with 800,000+ trusted titles and best-sellers across business, personal growth, and the humanities. Includes unlimited reading time and Standard Read Aloud voice.
- Complete: Perfect for advanced learners and researchers needing full, unrestricted access. Unlock 1.4M+ books across hundreds of subjects, including academic and specialized titles. The Complete Plan also includes advanced features like Premium Read Aloud and Research Assistant.
We are an online textbook subscription service, where you can get access to an entire online library for less than the price of a single book per month. With over 1 million books across 990+ topics, we’ve got you covered! Learn about our mission
Look out for the read-aloud symbol on your next book to see if you can listen to it. The read-aloud tool reads text aloud for you, highlighting the text as it is being read. You can pause it, speed it up and slow it down. Learn more about Read Aloud
Yes! You can use the Perlego app on both iOS and Android devices to read anytime, anywhere — even offline. Perfect for commutes or when you’re on the go.
Please note we cannot support devices running on iOS 13 and Android 7 or earlier. Learn more about using the app
Please note we cannot support devices running on iOS 13 and Android 7 or earlier. Learn more about using the app
Yes, you can access Identifying and Managing Project Risk by Tom Kendrick in PDF and/or ePUB format, as well as other popular books in Business & Business Strategy. We have over one million books available in our catalogue for you to explore.