A surprising look at how ancestry still determines social outcomes
How much of our fate is tied to the status of our parents and grandparents? How much does it influence our children? More than we wish to believe. While it has been argued that rigid class structures have eroded in favor of greater social equality, The Son Also Rises proves that movement on the social ladder has changed little over eight centuries. Using a novel technique—tracking family names over generations to measure social mobility across countries and periods—renowned economic historian Gregory Clark reveals that mobility rates are lower than conventionally estimated, do not vary across societies, and are resistant to social policies.
Clark examines and compares surnames in such diverse cases as modern Sweden and Qing Dynasty China. He demonstrates how fate is determined by ancestry and that almost all societies have similarly low social mobility rates. Challenging popular assumptions about mobility and revealing the deeply entrenched force of inherited advantage, The Son Also Rises is sure to prompt intense debate for years to come.
- 384 pages
- English
- ePUB (mobile friendly)
- Available on iOS & Android
eBook - ePub
About this book
Trusted by 375,005 students
Access to over 1.5 million titles for a fair monthly price.
Study more efficiently using our study tools.
Information
Publisher
Princeton University PressYear
2014Print ISBN
9780691168371
9780691162546
eBook ISBN
9781400851096
ONE
Introduction
Of Ruling Classes and Underclasses: The Laws of Social Mobility
FIGURE 1.1 SHOWS A BOY IN GOVAN, a grim, deprived district of my hometown, Glasgow, in my youth in the 1970s. Will his children, grandchildren, and great-grandchildren be found in similar circumstances? To what extent would the chances of a middle-class child of equal ability, placed in the same family in Govan, be reduced by the poverty of his parents? Figure 1.2, in contrast, shows the pleasant suburban Glaswegian street I grew up in, appropriately named Richmond Drive. To what extent is the status of the children raised in that street predictable just from that picture? To what extent would their fortunes have changed had they been raised in Govan?
These questions have, of course, been the subject of extensive enquiry by sociologists and economists.1 Most people believe that high rates of social mobility are fundamental to the good society. How can we justify the inequalities of income, wealth, health, and longevity so characteristic of the capitalist economy unless any citizen, with sufficient courage and application, has a chance of attaining the grand prizes? Why wouldn’t those in the bottom half of the income distribution in a democracy punitively extract resources from the top half if they have no prospect of ever obtaining these goods through the market system?
A convenient summary measure we can use for intergenerational mobility is the correlation of the income, wealth, education, occupational status, and even longevity, of parents and children. This correlation varies from zero to one. Zero represents complete intergenerational social mobility, with no correlation between generations: under these conditions, we can predict nothing about children’s outcomes from the circumstances of their birth. A correlation of one represents complete immobility, with a perfect correlation between the status of children and parents: we can predict at birth the entire outcome for any child.2

FIGURE 1.1. Boy playing football in Govan, Glasgow, Scotland, 2008.

FIGURE 1.2. Richmond Drive, Cambuslang, Glasgow.
This intergenerational correlation is closely related to another important concept, that of the rate of regression to the mean (calculated as one minus the correlation). This is the average rate at which families or social groups that diverge from the mean circumstances of the society move toward that mean in each generation. Thus we refer to the intergenerational correlation as the persistence rate of characteristics. The intergenerational correlation can be interpreted as a measure of social entropy. The lower this correlation, the greater the degree of social entropy, and the quicker a particular structure of advantage and disadvantage in any society is dissolved.
The intergenerational correlation also has a convenient intuitive interpretation. The square of the correlation is the share of the variation in social status that is explained by inheritance. That share will also be between zero and one. For practical purposes, if the correlation is less than 0.3, then the square is 0.09 or less, suggesting that almost none of the outcomes for the current generation are predictable from parents’ circumstances. In such a society, each generation is born anew. The past has little effect on the present. The intergenerational correlation thus indicates the degree to which the accidents of our birth, or, more precisely, our conception, determine our fate.
Most people believe, from their own experience of families, friends, and acquaintances, that we live in a world of slow social mobility. The rich beget the rich, the poor beget the poor. Between the Old Etonian and the slum dweller, between Govan and Richmond Drive, lies a gulf of generations. But a hundred years of research by psychologists, sociologists, and economists seems to suggest that this belief is fictional. Conventional estimates imply that social mobility is rapid and pervasive. The Old Etonian and the slum dweller are cousins.
Standard estimates suggest high modern intergenerational mobility rates. Figure 1.3, for example, shows estimated intergenerational correlations of earnings across a variety of countries. That correlation ranges between 0.15 and 0.65. But these rates imply that inheritance explains only 2 percent to 40 percent of the variation in individual incomes in any generation. Figure 1.4 shows the same pattern for years of schooling, with implied intergenerational correlations ranging from 0.3 to 0.65. Only 9 percent to 40 percent of the variation in years of schooling is explained by inheritance. Regression to the mean appears very strong, and human societies seemingly display a high degree of entropy in their social structure.
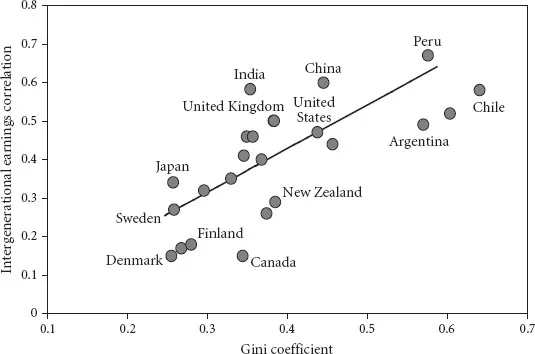
FIGURE 1.3. Intergenerational earnings correlation and inequality.
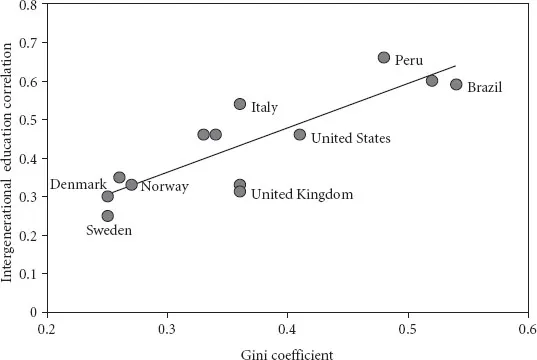
FIGURE 1.4. Intergenerational education correlation and income inequality.
If all the factors that determine people’s life chances are summarized by their parents’ status, then these persistence rates imply that all initial advantages and disadvantages for families should be wiped out within three to five generations. In this case the correlation in any measure of social status, such as income, between generations n steps apart is the intergenerational correlation raised to the power n. If the intergenerational correlation for income is 0.3, for example, then the correlation between grandparents and grandchildren is 0.32, or 0.09. Between great-grandparents and great-grandchildren, it is 0.33, or 0.027. Thus with intergenerational correlations in the range 0.15 to 0.65, correlations for subsequent generations quickly approach zero.
In the standard picture portrayed in figures 1.3 and 1.4, intergenerational mobility rates vary substantially across societies. They are high in the Nordic countries, which have lower income inequality. The degree of income inequality is represented by the Gini coefficient, which is zero with complete equality and one when a single person in society has everything and everyone else nothing. If much of the inequality in modern society is driven by inequality in access to capital, education, and social networks, then the good society would have a low rate of inheritance of social status and correspondingly low variations in income and wealth.
On the conventional picture of social mobility rates, the lower mobility rates observed in countries such as Britain or the United States represent a social failure. The life chances of the descendants of high- and low-status ancestors can be equalized at low social cost. The Nordic countries, after all, constitute one of the richest regions of the world, attractive in many other ways beyond the material: they enjoy high life expectancy, low crime rates, near gender equality, lack of corruption, and political transparency.
Within many societies, particular populations experience much slower rates of social mobility than others. In the United States, for example, blacks, Latinos, Native Americans, and Jewish Americans are all experiencing much slower movement upward or downward toward the mean than is predicted by the intergenerational correlation of 0.5 for income and education. This fact reinforces the idea that on conventional estimates, social mobility rates are suboptimal. Members of poorer minority groups, for example, seem to face greater barriers to mobility than do individuals of the majority population. Richer ethnic groups are able to entrench their social advantages through connections, networks, or access to wealth.
The association in figures 1.3 and 1.4 of greater social mobility rates in higher-income societies also suggests that one of the gains of the Industrial Revolution has been an increase in social mobility rates. The world has been on the march from a preindustrial society of great inequality, where fates were determined by the accidents of birth, to one where lineage and inheritance are of minor significance in an individual’s destiny.
Again under conventional mobility estimates, genetic transmission of talent must be unimportant in the determination of social success. Nurture dominates nature. Suppose genetic inheritance matters a lot. Suppose also that mating is assortative across all societies: high-status men marry high-status women. Under these conditions, there is a lower bound to the intergenerational correlation observed in well-functioning market economies. The very low correlations observed in Nordic countries imply that the importance of families and inheritance in determining socioeconomic success must be purely a feature of the social institutions of societies.
These conclusions from conventional scholarly estimates of social mobility rates, however, sit poorly with popular perceptions of social mobility. People looking back to their own grandparents, or forward to their grandchildren, do not generally see the kind of disconnect in status that these estimates imply. People looking at their siblings or cousins see a much greater correlation in status than is implied by the intergenerational correlations reported above.
Consider, for example, the case of the English family the Pepyses, made famous by Samuel Pepys, 1633–1703, first secretary of the English Admiralty, member of Parliament, and noted diarist (figure 1.5). Pepys has always been a rare surname, flirting with extinction. In 1881 there were only thirty-seven Pepyses in England, and by 2002 they were down to eighteen. Seventeenth-century parish records of baptisms and marriages suggest there were only about forty Pepyses living at one time even then. The Pepyses emerged from obscurity in 1496 when one of them enrolled at Cambridge University, and they have prospered ever since. Since 1496, at least fifty-eight Pepyses have enrolled at Oxford or Cambridge, most recently in 1995. For an average surname of this population size, the expected number of enrollees would be two or three. Of the eighteen Pepyses alive in 2012, four are medical doctors. The nine Pepyses who died between 2000 and 2012 have left estates with an average value of £416,000, more than five times the average estate value in England in this period. If the standard mobility estimates are correct, the chance that a family like this could maintain a high social status over seventeen generations is vanishingly small.3
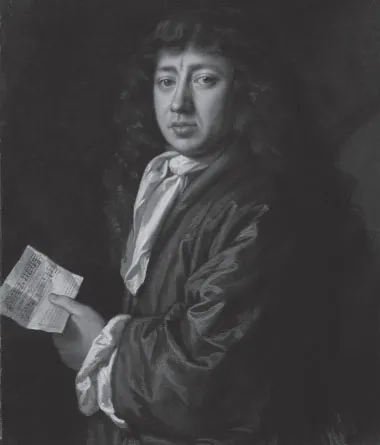
FIGURE 1.5. John Hayls, Samuel Pepys, 1666.
Pepys is not the only rare surname to maintain a surprising presence and persistence at the upper reaches of English society. The phenomenon is remarkably common. Sir Timothy Berners-Lee, OM, KBE, FRS, FREng, FRSA, the creator of the World Wide Web, is a descendant of a family that was rich and prominent in early-nineteenth-century England. But, further, the name Berners is descended from a Norman grandee whose holdings are listed in the Domesday Book of 1086. Sir Peter Lytton Bazalgette, the producer of the TV show Big Brother and chair of the Arts Council England, is a descendant of Louis Bazalgette, an eighteenth-century immigrant and tailor to the prince regent—the Ralph Lauren of his age—who died, leaving considerable wealth, in 1830.4
Alan Rusbridger, editor of the Guardian newspaper, that scourge of class privilege and inherited advantage, is himself the descendant of a family that achieved significant wealth and social position in Queen Victoria’s time. Rusbridger’s great-great-grandfather was land steward to His Grace the Duke of Richmond. The value of his personal estate at his death in 1850 was £12,000, a considerable sum at a time when four of every five people died with an estate worth less than £5.
Using surnames to track the rich and poor through many generations in various societies—England, the United States, Sweden, India, Japan, Korea, China, Taiwan, and Chile—this book argues that our commonsense intuition of a much slower rate of intergenerational mobility is correct. Surnames turn out to be a surprisingly powerful instrument for measuring social mobility.5 And they reveal that there is a clear, striking, and consistent social physics of intergenerational mobility that is not reflected in most modern studies of the topic.
The problem is not with the studies and estimates themselves. What they measure, they measure correctly. The problem arises when we try to use these estimates of mobility rates for individual characteristics to predict what happens over long periods to the general social status of families. Families turn out to have a general social competence or ability that underlies partial measures of status such as income, education, and occupation. These partial measures are linked to this underlying, not directly observed, social competence only with substantial random components. The randomness with which underlying status produces particular observed aspects of status creates the illusion of rapid social mobility using conventional measures.
Underlying or overall social mobility rates are much lower than those typically estimated by sociologists or economists. The intergenerational correlation in all the societies for which we construct surname estimates—medieval England, modern England, the United States, India, Japan, Korea, China, Taiwan, Chile, and even egalitarian Sweden—is between 0.7 and 0.9, much higher than conventionally estimated. Social status is inherited as strongly as any biological trait, such as height...
Table of contents
- Cover Page
- Title Page
- Copyright Page
- Dedication Page
- Contents
- Preface
- 1 Introduction: Of Ruling Classes and Underclasses: The Laws of Social Mobility
- Part I: Social Mobility by Time and Place
- Part II: Testing the Laws of Mobility
- Part III: The Good Society
- Appendix 1: Measuring Social Mobility
- Appendix 2: Deriving Mobility Rates from Surname Frequencies
- Appendix 3: Discovering the Status of Your Surname Lineage
- Data Sources for Figures and Tables
- References
- Index
Frequently asked questions
Yes, you can cancel anytime from the Subscription tab in your account settings on the Perlego website. Your subscription will stay active until the end of your current billing period. Learn how to cancel your subscription
No, books cannot be downloaded as external files, such as PDFs, for use outside of Perlego. However, you can download books within the Perlego app for offline reading on mobile or tablet. Learn how to download books offline
Perlego offers two plans: Essential and Complete
- Essential is ideal for learners and professionals who enjoy exploring a wide range of subjects. Access the Essential Library with 800,000+ trusted titles and best-sellers across business, personal growth, and the humanities. Includes unlimited reading time and Standard Read Aloud voice.
- Complete: Perfect for advanced learners and researchers needing full, unrestricted access. Unlock 1.5M+ books across hundreds of subjects, including academic and specialized titles. The Complete Plan also includes advanced features like Premium Read Aloud and Research Assistant.
We are an online textbook subscription service, where you can get access to an entire online library for less than the price of a single book per month. With over 1.5 million books across 990+ topics, we’ve got you covered! Learn about our mission
Look out for the read-aloud symbol on your next book to see if you can listen to it. The read-aloud tool reads text aloud for you, highlighting the text as it is being read. You can pause it, speed it up and slow it down. Learn more about Read Aloud
Yes! You can use the Perlego app on both iOS and Android devices to read anytime, anywhere — even offline. Perfect for commutes or when you’re on the go.
Please note we cannot support devices running on iOS 13 and Android 7 or earlier. Learn more about using the app
Please note we cannot support devices running on iOS 13 and Android 7 or earlier. Learn more about using the app
Yes, you can access The Son Also Rises by Gregory Clark in PDF and/or ePUB format, as well as other popular books in Economics & Economic History. We have over 1.5 million books available in our catalogue for you to explore.