Hispanics account for more than half the population growth in the United States over the last decade. With this surge has come a dramatic spike in the number of Hispanic-owned businesses. Hispanic Entrepreneurs in the 2000s is a pioneering study of this nascent demographic. Drawing on rich quantitative data, authors Alberto Dávila and Marie T. Mora examine key economic issues facing Hispanic entrepreneurs, such as access to financial capital and the adoption and vitality of digital technology. They analyze the varying effects that these factors have on subsets of the Hispanic community, such as Mexican Americans, Puerto Ricans, Cubans, and Salvadorans, while considering gender and immigrant status. This account highlights key policies to drive the success of Hispanic entrepreneurs, while drawing out strategies that entrepreneurs can use in order to cultivate their businesses. Far-reaching and nuanced, Hispanic Entrepreneurs in the 2000s is an important study of a population that is quickly becoming a vital component of American job creation.
eBook - ePub
Hispanic Entrepreneurs in the 2000s
An Economic Profile and Policy Implications
- 256 pages
- English
- ePUB (mobile friendly)
- Available on iOS & Android
eBook - ePub
Hispanic Entrepreneurs in the 2000s
An Economic Profile and Policy Implications
About this book
Trusted by 375,005 students
Access to over 1.5 million titles for a fair monthly price.
Study more efficiently using our study tools.
Information
Publisher
Stanford Economics and FinanceYear
2013Print ISBN
9780804777933
Edition
1eBook ISBN
9780804788014
1
A Macro View of Hispanic Self-Employment in the 2000s
HISPANICS REPRESENTED ONE OUT OF EVERY SIX PEOPLE in the United States in 2010, up from one out of eight a decade earlier. Arguably, this Hispanic population growth was the catalyst for the sharp increase in the number of Hispanic business owners in the 2000s. For example, the most recent version of the Survey of Business Owners (SBO) reports that the number of Hispanic-owned businesses increased by 43.7 percent, from 1.6 million to 2.3 million firms, between 2002 and 2007, tripling the 14.5 percent growth in the number of businesses owned by non-Hispanics.
Figure 1.1 illustrates the rise in Hispanic entrepreneurship in the 2000s.1 The representation of Hispanics among the self-employed aged 25–64 increased by 58.5 percent, from 8.2 percent to 13.0 percent, between 2000 and 2010 (see Panel A). This increase outstripped the 36.4 percent growth among Hispanics workers in general during this time. While Hispanics remained underrepresented in the self-employment sector, these changes served to reduce the extent of the underrepresentation of this population by the end of the decade.
A closer examination of the self-employed indicates that the disproportionate growth of Hispanics in the entrepreneurial sector stemmed from their rising presence in the U.S. workforce and from the strengthening of entrepreneurial tendencies within the Hispanic population. Indeed, our estimates reveal that Hispanic self-employment rates significantly increased from 7.9 percent in 2000 to 9.1 percent in 2010, rising almost every year during the decade. In contrast, despite increasing in the early 2000s, the self-employment rates of non-Hispanic workers declined over the time frame. Hispanics particularly narrowed their self-employment gap vis-à-vis non-Hispanics in the second half of the decade.
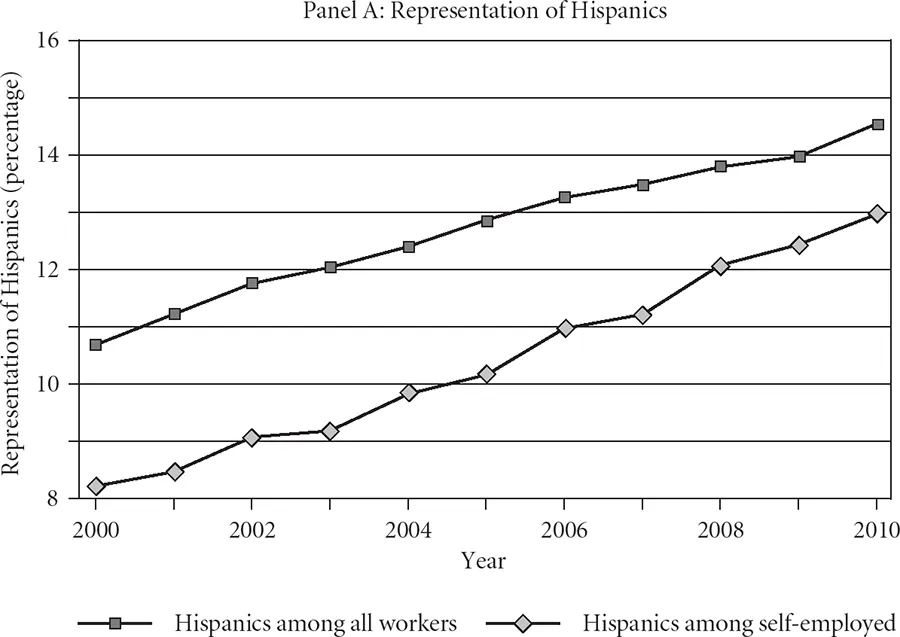
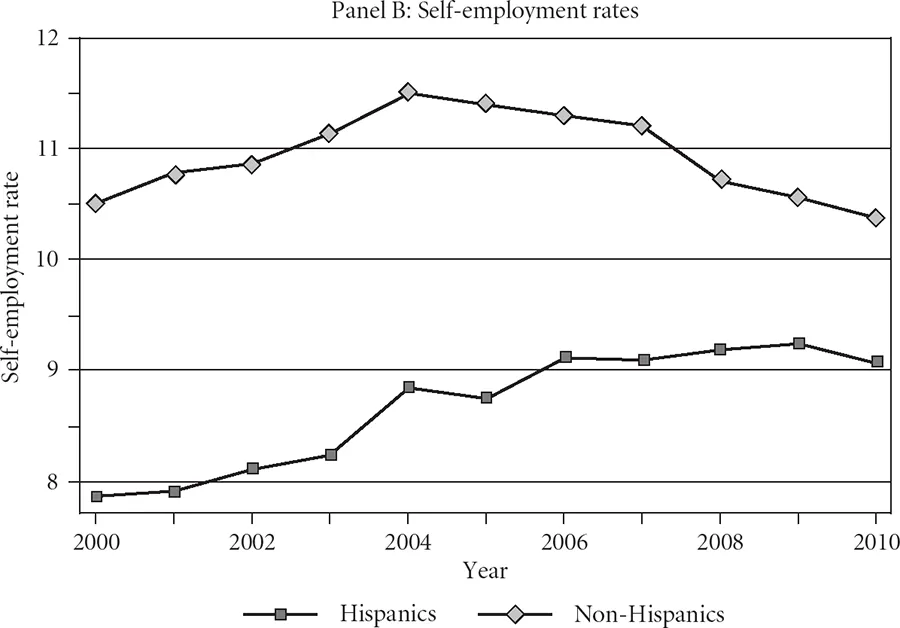
FIGURE 1.1 Representation of Hispanics in the workforce and Hispanic and non-Hispanic self-employment rates, 2000–10
SOURCE: Authors’ estimates using PUMS and ACS data in the IPUMS.
NOTES: The sample includes workers between the ages of twenty-five and sixty-four not living in group quarters.
We provide in this chapter an overview of these changing entrepreneurial tendencies among the Hispanic population, which will set the stage for more detailed topics discussed later in the book. This chapter also presents information on the heterogeneity of the Hispanic population, such that one-size-fits-all policies affecting Hispanics overall could have disparate implications for specific Hispanic groups.
Hispanic Self-Employment and Macroeconomic Conditions
The first ten years of the new millennium witnessed historically sharp variations in the business cycle. This decade provided entrepreneurial opportunities, but it also brought with it significant challenges for entrepreneurs. To begin exploring this issue, we consider changes in the business cycle measured by annual economic growth rates (i.e., the percentage change in real gross domestic product). While U.S. economic growth slowed from 4.1 percent in 2000 to 1.1 percent in 2001, it mostly recovered from this slowdown over the following few years, as the economy expanded by 3.5 percent in 2004. After 2004, the U.S. economy began to slow down, and eventually it hit an economic recession in 2008 (or the Great Recession, which technically started in December 2007). The economy shrank by 0.3 percent in 2008, and despite the fact that the Great Recession officially ended in June 2009, throughout 2009 the economy contracted by another 3.5 percent. By 2010, economic output rebounded, growing at an annualized rate of 3.0 percent.
With few exceptions, the self-employment rates of non-Hispanic workers moved with economic growth. As the economy grew, in general so did non-Hispanic self-employment rates. When the economy slowed down, the entrepreneurial tendencies of non-Hispanic workers fell (although they kept falling in 2010, despite the recovery). Through 2005, the self-employment rates of Hispanics changed in a similar fashion as those of non-Hispanics. In much of the second half of the decade, however, Hispanic entrepreneurial tendencies moved in the opposite direction from those of non-Hispanics. The Hispanic self-employment rate peaked at 9.3 percent in 2009, and while it declined to 9.1 percent in 2010, it remained higher than at the height of the business cycle.
What might explain the resilience of Hispanic self-employment rates in the face of a slowing economy in the second part of the decade? An answer to this question involves an understanding of the factors that influence the self-employment decision and self-employment survival. From an individual perspective, research on the factors related to business ownership points to the relative returns to entrepreneurial employment, human capital, credit access from institutions and families (including family experience in self-employment), and preferences for business ownership. The group perspective points to the importance of labor-market discrimination and social capital in leading to the entrepreneurship decision.
The self-employment decision has also been cast in terms of occupation and industry, as well as spatial differentials. For example, economists Magnus Lofstrom and Chunbei Wang, in a 2009 study of the self-employment patterns of Mexican Americans, noted the importance of recognizing potential issues related to heterogeneity in business ownership across industries, such as differences in the “human and financial capital intensiveness” among ethnic groups, which might lead to different barriers to entry across industries. Economists Timothy Bates and Alicia Robb (2008) further reported that minority neighborhoods do not offer the same business opportunities as the broader regional marketplace; they concluded that the housing market in minority neighborhoods is associated with reduced business viability.
Of course, these are but some of the myriad issues related to business ownership and survival in the entrepreneurship literature. The purpose of the foregoing discussion is to provide initial context; we delve more deeply into the literature on these (and other) issues throughout this book.
For now, consider the impact of the economic slowdown in the 2000s on the labor market for Hispanics. Panel A in Figure 1.2 shows the unemployment rates of the Hispanic and non-Hispanic civilian population between 2000 and 2010, based on our estimates from data from the U.S. Bureau of Labor Statistics. The unemployment rates of Hispanics exceeded those of non-Hispanics in every year shown, although they tended to move together. For example, the unemployment rates for both groups rose steadily between 2000 and 2003, and then declined through the middle years of this period. After reaching a trough of 5.2 percent in 2006, the Hispanic unemployment rate increased sharply thereafter, increasing by 2.4 times to 12.5 percent in 2010. This result indicates that the Great Recession negatively affected employment opportunities in general, but disproportionately so for Hispanics than for the workforce overall.
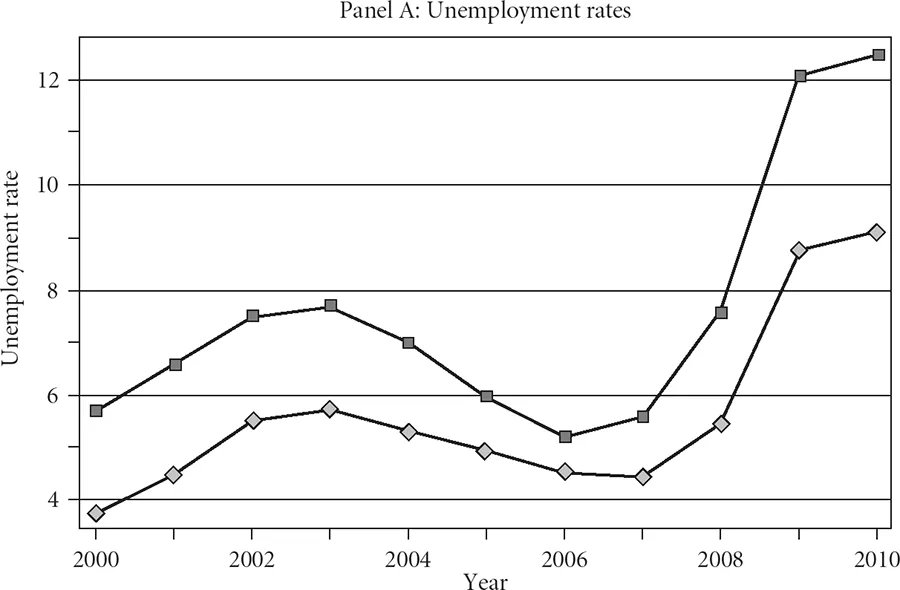
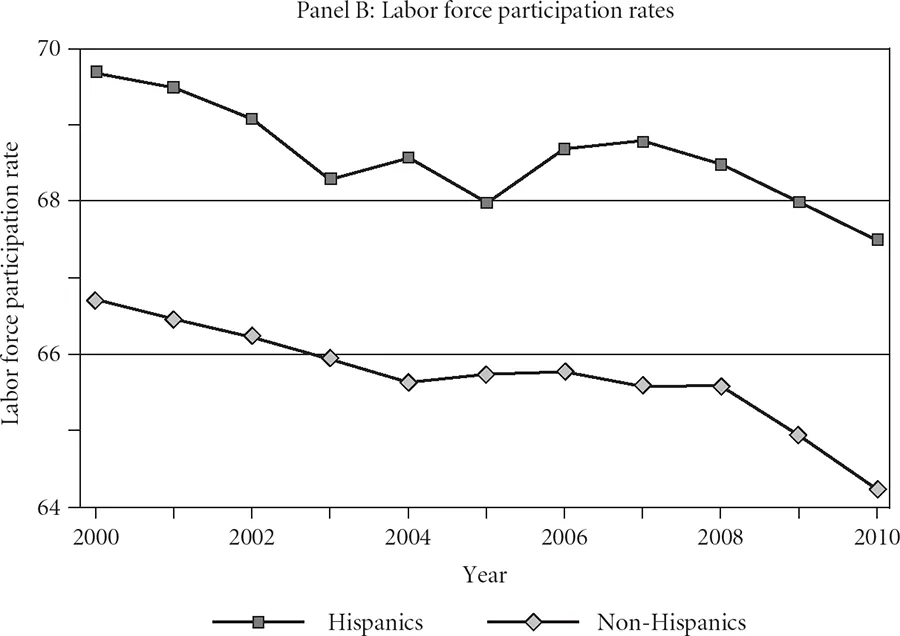
FIGURE 1.2 Unemployment and labor-force participation rates among Hispanics and non-Hispanics, 2000–10
SOURCE: Authors’ estimates using data from the U.S. Bureau of Labor Statistics.
NOTE: The sample includes noninstitutionalized civilians aged sixteen and older.
Panel B in Figure 1.2 contains the labor-force participation rates (LF-PRs) of both groups. The LFPRs show that Hispanics were more likely to be in the labor force than non-Hispanics, and the gap remained fairly steady throughout the decade. In 2000, the LFPR for Hispanics of 69.7 percent was three percentage points higher than that for non-Hispanics. In 2010, the LFPR for Hispanics had fallen to 67.5 percent, and that of non-Hispanics reached 64.2 percent; for both groups, these were the lowest LFPRs in the entire decade.
Except during the Great Recession, the self-employment rates of non-Hispanics appear in lockstep with their unemployment rates. Namely, until 2008, self-employment rates for non-Hispanics tended to increase when unemployment rates for non-Hispanics were rising, and they fell when unemployment rates for non-Hispanics declined. For Hispanics, however, self-employment tended to increase when unemployment rates for Hispanics were rising in the first and last part of the decade (except in 2010), but they also increased in the middle of the decade (except for 2005)—a time when unemployment rates for Hispanics were falling.
Self-employment activities in the Hispanic population throughout the decade thus did not appear to be solely driven by cyclical conditions in the labor market. In the following chapter, we provide a more detailed discussion of whether Hispanics and non-Hispanics were pushed into self-employment at certain times because of a dearth of job prospects or whether the growing self-employment rates reflected increasing business opportunities that pulled them into the entrepreneurial sector. The remainder of this chapter explores other macroeconomic facets of Hispanic entrepreneurship.
The Representation of Microentrepreneurs Among Hispanic Business Owners
The foregoing discussion suggests a general increase in self-employment rates among Hispanics during the first decade of the 2000s. Indeed, during the economic expansion as well as through the slowdown and recession, Hispanic participation in entrepreneurial activities intensified. While these trends indicate that Hispanic entrepreneurs were creating jobs for themselves, how did they fare in terms of creating jobs for other workers?
Using SBO data from 2002 and 2007, Hispanic-owned businesses created on net four hundred thousand new jobs, as their total number of paid employees increased from 1.5 million to 1.9 million workers. Non-Hispanic-owned businesses added more than six hundred thousand jobs over the five-year period. This information indicates that Hispanic-owned enterprises disproportionately contributed to the creation of new paid-employment positions between 2002 and 2007. At the same time, the growth in the number of jobs created by Hispanics was smaller than the overall growth in the number of Hispanic-owned businesses, such that the average number of paid employees per firm declined (from about 1 worker to 0.8 workers per firm). The average number of workers per non-Hispanic-owned businesses also fell during this time (from 2.6 to 2.3), but by a slightly smaller proportion. As such, the expansion in Hispanic entrepreneurship in the first decade of the millennium occurred mainly at the level of very small firms.
Another way to investigate these patterns is to consider the share of microentrepreneurs among Hispanic entrepreneurs. We define microentrepreneurs as those businesses that have fewer than ten paid employees. We thus turn to the Public Use Microdata Sample (PUMS) of the 2007 SBO. (A comparable version of the 2002 SBO does not exist.) As described in Appendix A, the 2007 SBO PUMS (released by the U.S. Census Bureau in August 2012) contains detailed demographic, socioeconomic, and business-related characteristics based on the 2007 SBO questionnaire. In these data, nearly all (98.1 percent) Hispanic-owned firms had fewer than ten employees; this share was slightly higher than the 95.4 percent of businesses owned by non-Hispanics that had fewer than ten workers. These numbers are high partly because the vast majority of firms, particularly those owned by Hispanics, did not have employees: employer firms represented about one in ten (11.1 percent) of Hispanic-owned businesses and one in five (79.1 percent) of other businesses. When focusing exclusively on employers, microentrepreneurs were slightly overrepresented among Hispanics in 2007, as 82.6 percent had fewer than ten employees, compared to 77.9 percent among their non-Hispanic peers.
Moreover, turning to an alternative data set (the Current Population Survey, or CPS) that contains information on the number of employees working for the self-employed, we find that in every year between 2000 and 2010, microentrepreneurs represented higher shares of self-employed Hispanics than non-Hispanics, although the gap did not remain constant. Consider Figure 1.3, which presents these shares. Between 2001 and 2003, the increase in self-employment among Hispanics occurred with a rising incidence of microentrepreneurship. Perhaps more Hispanics perceived lucrative business opportunities in the small-business sector during the economic expansion, thus leading to more Hispanic-owned microenterprises. Rates of Hispanic microentrepreneurs among the self-employed fell between 2005 and 2007, when the economy was slowing down.
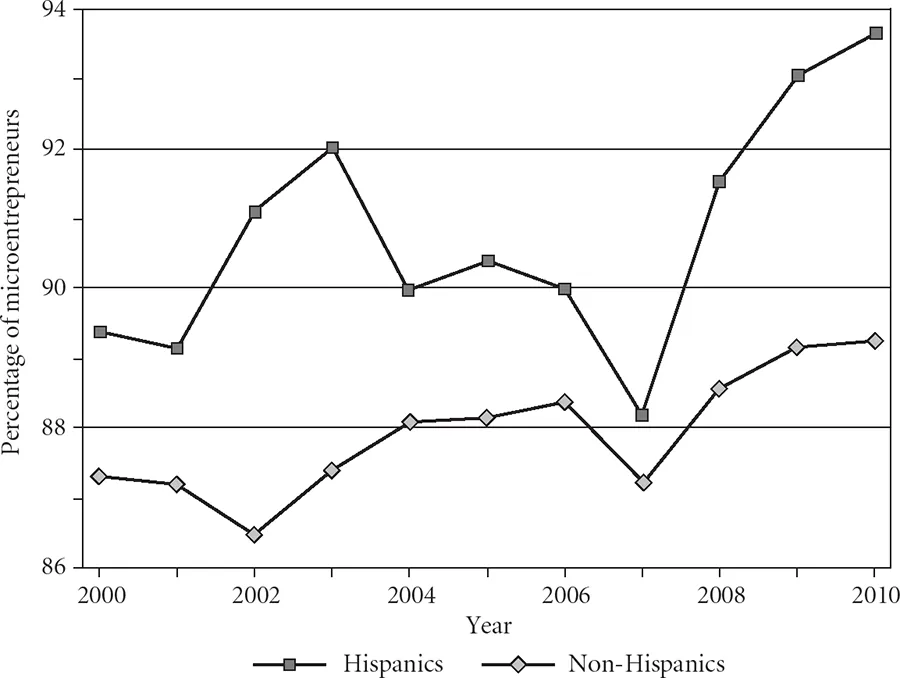
FIGURE 1.3 Representation of microentrepreneurs among self-employed Hispanics and non-Hispanics, 2000–10
SOURCE: Authors’ estimates using CPS data in the IPUMS-CPS for microentrepreneurship (defined as having fewer than ten employees).
NOTES: The sample includes self-employed workers between the ages of twenty-five and sixty-four. The year is the year in which the individual was a microentrepreneur (the year prior to the CPS survey); see Appendix A.
With the onset of the Great Recession, the representation of microentrepreneurs among both self-employed Hispanics and non-Hispanics increased (although more sharply for Hispanics), thus resulting in the highest microentrepreneurship rates for the decade (93.7 percent for Hispanics and 89.3 percent for non-Hispanics) in 2010. In general, these results indicate that the rapidly growing population of Hispanic entrepreneurs affected microenterprises in the first decade of the 2000s. Hispanic entrepreneurial growth appears to have had a positive impact on job creation, but mostly at the scale of smaller firms, especially at the end of the decade. Later in this book, we return to the issue of microentrepreneurship by exploring gender- and immigrant-related variations in the shares of microentrepreneurs.
Another aspect related to firm size concerns the share of incorporated versus other types of businesses. Incorporated businesses tend to be larger than unincorporated firms with respect to several dimensions, including number of employees, sales, assets, and profits.2 Using data from the Public Use Microdata Sample of the 2000 decennial census as well as from the 2001–10 American Community Surveys (ACS), we estimate that Hispanic-owned businesses had lower shares of incorporated firms in every year in the first decade of the 2000s than firms owned by non-Hispanics. The highest rate of incorporated firms for Hispanics occurred in 2000 (at 28 percent). This was also the year when the gap in this rate between Hispanics and non-Hispanics was narrowest.
Furthermore, changes in the ratio of Hispanic-owned incorporated versus unincorporated firms did not mirror such changes among other businesses overall. The incorporated share among Hispanics fell sharply in 2001; reached its lowest level (21.4 percent) in 2002; and began climbing until 2005, when it reached 26.8 percent. After that year, there was a general decline in the share of incorporated firms among Hispanic entrepreneurs, such that the decade ended with 23.3 percent of self-employed Hispanics operating incorporated firms. For non-Hispanics, with few exceptions, their shares of incorporated businesses rose throughout the decade (from 32.3 percent in 2000 to 36.4 percent in 2010). Combined with the declining incorporated shares among Hispanic entrepreneurs after 2005, such changes led to a widening of the difference between Hispanics and non-Hispanics in these shares in the second part of the decade. These changes again point to the notion that the rising self-employment rates of Hispanics during the economic slowdown and subsequent recession led to an increase in smaller-scale Hispanic-owned businesses.
Industry and Geographic Region
Industry. An additional question relates to whether the growth in Hispanicowned businesses occurred evenly across the industrial spectrum in the 2000s, or whether it remained concentrated in particular industries. Such information is important to consider given the sensitivity of certain industries (e.g., construction) to macroeconomic events, while others (e.g., personal services) tend to be more insulated. It is also important to consider the cost of entering these industries, as suggested by the Lofstrom and Wang study mentioned earlier.
Fo...
Table of contents
- Cover
- Copyright
- Title Page
- Acknowledgments
- Contents
- List of Figures and Tables
- Preface
- 1. A Macro View of Hispanic Self-Employment in the 2000s
- 2. Entrepreneurial Earnings of Hispanics in the 2000s
- 3. Hispanic-Immigrant Entrepreneurs
- 4. Education and Hispanic Entrepreneurs
- 5. Hispanic Female Entrepreneurs
- 6. Strategic Issues for Hispanic Entrepreneurs—Credit Access
- 7. Strategic Issues for Hispanic Entrepreneurs—Technology Usage
- 8. Current Policy Issues for Hispanic Entrepreneurs
- 9. In Closing
- Appendix A: Major Data Sets Used and Construction of Key Variables
- Appendix B: Details Behind the Empirical Analyses
- Notes
- References
- Index
Frequently asked questions
Yes, you can cancel anytime from the Subscription tab in your account settings on the Perlego website. Your subscription will stay active until the end of your current billing period. Learn how to cancel your subscription
No, books cannot be downloaded as external files, such as PDFs, for use outside of Perlego. However, you can download books within the Perlego app for offline reading on mobile or tablet. Learn how to download books offline
Perlego offers two plans: Essential and Complete
- Essential is ideal for learners and professionals who enjoy exploring a wide range of subjects. Access the Essential Library with 800,000+ trusted titles and best-sellers across business, personal growth, and the humanities. Includes unlimited reading time and Standard Read Aloud voice.
- Complete: Perfect for advanced learners and researchers needing full, unrestricted access. Unlock 1.5M+ books across hundreds of subjects, including academic and specialized titles. The Complete Plan also includes advanced features like Premium Read Aloud and Research Assistant.
We are an online textbook subscription service, where you can get access to an entire online library for less than the price of a single book per month. With over 1.5 million books across 990+ topics, we’ve got you covered! Learn about our mission
Look out for the read-aloud symbol on your next book to see if you can listen to it. The read-aloud tool reads text aloud for you, highlighting the text as it is being read. You can pause it, speed it up and slow it down. Learn more about Read Aloud
Yes! You can use the Perlego app on both iOS and Android devices to read anytime, anywhere — even offline. Perfect for commutes or when you’re on the go.
Please note we cannot support devices running on iOS 13 and Android 7 or earlier. Learn more about using the app
Please note we cannot support devices running on iOS 13 and Android 7 or earlier. Learn more about using the app
Yes, you can access Hispanic Entrepreneurs in the 2000s by Alberto Dávila,Marie T. Mora in PDF and/or ePUB format, as well as other popular books in Business & Entrepreneurship. We have over 1.5 million books available in our catalogue for you to explore.