![]()
CHAPTER 1
How to Recognize Spatial Problems and Opportunities by Becoming a “Spatial Thinker”
Now that you have an overview of location analytics it’s time to train your thinking to recognize when this methodology can be properly used. Location analytics stands for the analysis, measure, and display of location data. This term can apply to many different business categories other than just real estate. So how do you learn to recognize when to take advantage of this powerful tool? One way is to review case studies and articles on how others have used location analytics to solve problems or improve business operations. Later in this book we will go into some of these more detailed case studies. Another way is to train your brain to recognize spatial data sources as well as have an understanding of the analysis you can perform when you combine these geospatial data layers. You will be amazed at how much free data is out there, and you will be frustrated by the inconsistency of data availability from similar organizations. For example, one county will have a lot of free data available and then the county adjacent to it will charge so much for that data that it becomes unaffordable for your project. There is a lot of controversy over this. Since the government created the data in the first place many argue that they can’t charge for something that the taxpayer has already paid for. Others point out that the data should be available under the “Freedom of Information Act.” In any case, you will have to be prepared for this inconsistency if you deal with data produced by a county government organization.
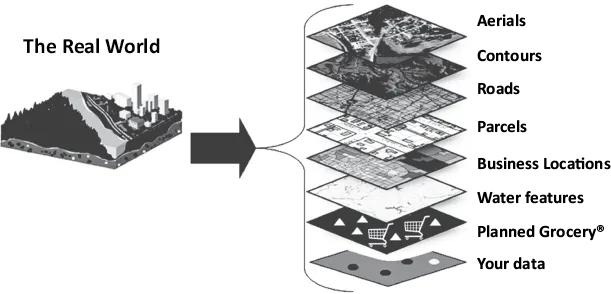
Figure 1.1 below shows how information on the earth’s surface is organized into data layers. Those data layers can then be interacted with in a GIS mapping program.
Figure 1.1 Example of how the real world translates to GIS layers
Spatial thinking requires you to look at problems as layers of data stacked together. For example, if you need the population of a one-mile radius from location. First you need the location—this is a point layer, then you need a radius—this is a circle polygon layer, now you need a demographics layer—this is another polygon layer. If you stack the radius layer over the demographics layer—then you can use GIS to aggregate the proportional population to the radius. Think of the radius as a cookie-cutter; the radius will carve out the proportional population from the demographics layer and assign it to the radius layer.
Now think about a shopping center for example. How many layers of data can you imagine would surround a shopping center? Shopping centers have parcel boundaries that carry zoning restrictions. They also have value based on rents and cap rates. Shopping centers have demographics, traffic counts, parking spaces, and light poles. Each retailer in the center has a customer trade area composed of the customer’s home and work locations. All the retailers in the center also have different lease financial terms, separate lease restrictions, and varying lease durations with varying options for renewals. Much of this data is spatial or at least tied to spatial data features. Spatial thinking requires you to not only consider the physical spatial data features but also the associated data attributes as well because many enterprise systems have links to non-spatial data that are in linked tables.
Imagine that you work for a shopping center real estate company. What spatial problems might you be asked to solve and what opportunities might there be to use location analytics? First, that depends on the level of sophistication of the company’s GIS, its integration with other company data systems, and the level of detail and accuracy of their data. Creating a demographics table from the shopping center point locations would be fairly simple but totaling the parking spaces of the shopping center portfolio or finding the total square footage of asphalt in the property portfolio would require a very detailed property data set. Creating a trade area for each center would be difficult without having any data on where the center’s customers are coming from and knowing how much they spend. With the right retailer data sets, like the data from AggData LLC for example, an analyst could perform a gap analysis to see what retailers are missing from any given market. This analysis would then be used by the leasing department to gauge the interest of retailers to fill space in the shopping center.
Mr. Paul Amos, who at the time of writing this book was Director of the Wharton GIS Research Laboratory at the University of Pennsylvania, spoke to me about business opportunities for spatial thinkers working at companies that are expanding internationally: “Firms that can take advantage of new and unique databases can gain a competitive advantage with location analytics. I’ve seen growing availability of international demographic databases which can certainly help a multi-national company with their location analytics needs. The precision of these databases are not as detailed to small geographic regions like census block groups in the US or postal codes in Canada. I’m sure these databases will continue to be enhanced and much like a real imagery was 10 years ago, these data will become more commonplace and inexpensive as the adoption rate increases,” said Mr. Amos.
Here at Beitz and Daigh Geographics we have a product called the “Opportunity Surface” that is used mostly for real estate market analysis. Opportunity surface puts spatial thinking to use by combining all the necessary locational elements into layers that are then overlaid onto a grid for scoring. From this we can produce a map or aerial that highlights the areas that best meet the combination of those elements. For example, many real estate analysts evaluate locations based on the demographics of a three-mile radius. But to find the locations with the best demographics it is not practical to run three-mile demographics one by one for thousands of locations. This is where the grid (Opportunity Surface™) comes in. For a city we create a grid with quarter mile (0.25) grid boxes. Each grid is 0.25 square miles. One city can have thousands of grids. Then we use the GIS to create centroids of each grid. A centroid is the center point of each grid. This centroid layer is then used to run three-mile demographics for each point. Then we calculate demographics for each three-mile radius. Most often for real estate we look at population, income, education, and number of employees (otherwise known as daytime population). Then we score the radius based on weights of the demographic variables. The results are then appended back to the grid so we can create color coded (thematic) maps that highlight grids with the best scores.
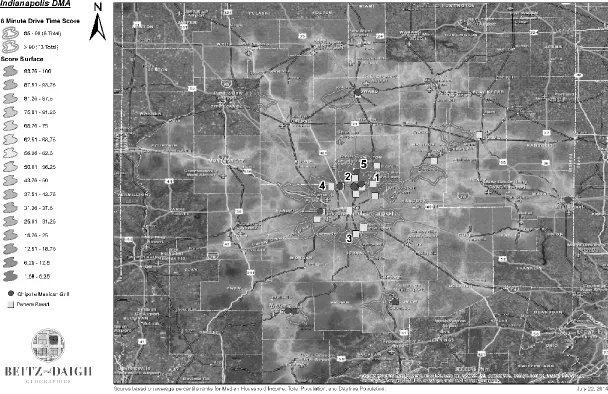
Below in Figure 1.2 we have a grid analysis that we did for a company that was looking for locations with demographics similar to Chipotle Mexican Grill and Panera Bread for the Indianapolis metropolitan statistical area. First, we ran eight-minute drive times for the Chipotle Mexican Grills and Panera Breads in the area. We chose eight minutes because we felt that was a fairly accurate standard trade area. From there we looked at the median incomes, total populations, and daytime populations (employment) for these stores and came up with scoring based on those variables. The scoring weighted the variables so that the areas with similar population, daytime population, and incomes would score well. Then we ran a 0.25-mile grid for the area, calculated the centroids of the grids, and ran eight-minute drive times from all of the grid centroids. Lastly, we scored the eight-minute drive time trade areas to see which trade areas scored the best. The numbers 1, 2, 3, and 4 in Figure 1.2 indicate the four highest scoring trade areas.
Figure 1.2 Opportunity Surface™ example showing top 5 best locations based on criteria
A good spatial thinker combines industry and data knowledge with a solid understanding of the capabilities of GIS software analysis. They strive to create and maintain accurate data sets and never miss an opportunity to capture data points if that data will be valuable or will save time down the road. Many organizations have unrecognized spatial data sets that are the key to unlocking future growth. Spatial thinkers learn to seek out these data sets and then mine them for ways to create value for the organization.
![]()
CHAPTER 2
Location Analytics Project Development
First it helps to understand the steps involved in assessing and then implementing a location analytics project. In the next chapter, I’ll tell you about a retail real estate marketing project that my consulting group Beitz and Daigh Geographics, Inc. worked on and you will see these steps first hand. But first let’s look at the basic steps in a location analytics project.
Here is a basic outline of the steps in the process:
- Start with your questions and goals
- Determine your study area
- Assess your data requirements
- Assess your software and 3rd party services need
- Check the budget to see if it all works
- Create a phased approach if necessary
- Perform the analysis and recalibrate as necessary
- Evaluate results
- Create a plan to communicate and act on your findings
Project Start
Once you have recognized an opportunity to use location analytics then it’s time to get your project going. If you work for a large organization be careful to not let the scope get too big for your project. Often companies get stuck at the beginning of a project by creating an unusually large scope of work. If the scope gets very large, then break the project into phases so you can get the project going. Taking it slow by implementing a solid phase 1 will go a long way toward your success. I have seen many companies try and do too many things at one time, and they end up doing nothing partially well. Then you have a bunch of half-done phases trying to connect and it turns into a disaster. You may also consider creating a request for proposal (RPF) that details your requirements. This way you can shop the RPF to several companies to better compare pricing, timing, and approaches. If you are doing this project internally then it still helps to have a scope of work or project goals document. This way you can clearly communicate the goals of the project, stay on task, and highlight areas where the project needs improvement.
Study Area
Determine your study area early. There is nothing worse than creating a great project only to have your client come back and ask “But what about this state or that city?” Set clear expectations...