Getting Started with Haskell Data Analysis
eBook - ePub

Getting Started with Haskell Data Analysis

Put your data analysis techniques to work and generate publication-ready visualizations

James Church

Share book
  1. 160 pages
  2. English
  3. ePUB (mobile friendly)
  4. Available on iOS & Android
eBook - ePub

Getting Started with Haskell Data Analysis

Put your data analysis techniques to work and generate publication-ready visualizations

James Church

Book details
Book preview
Table of contents
Citations

About This Book

Put your Haskell skills to work and generate publication-ready visualizations in no time at all

Key Features

  • Take your data analysis skills to the next level using the power of Haskell
  • Understand regression analysis, perform multivariate regression, and untangle different cluster varieties
  • Create publication-ready visualizations of data

Book Description

Every business and organization that collects data is capable of tapping into its own data to gain insights how to improve. Haskell is a purely functional and lazy programming language, well-suited to handling large data analysis problems. This book will take you through the more difficult problems of data analysis in a hands-on manner.

This book will help you get up-to-speed with the basics of data analysis and approaches in the Haskell language. You'll learn about statistical computing, file formats (CSV and SQLite3), descriptive statistics, charts, and progress to more advanced concepts such as understanding the importance of normal distribution. While mathematics is a big part of data analysis, we've tried to keep this course simple and approachable so that you can apply what you learn to the real world.

By the end of this book, you will have a thorough understanding of data analysis, and the different ways of analyzing data. You will have a mastery of all the tools and techniques in Haskell for effective data analysis.

What you will learn

  • Learn to parse a CSV file and read data into the Haskell environment
  • Create Haskell functions for common descriptive statistics functions
  • Create an SQLite3 database using an existing CSV file
  • Learn the versatility of SELECT queries for slicing data into smaller chunks
  • Apply regular expressions in large-scale datasets using both CSV and SQLite3 files
  • Create a Kernel Density Estimator visualization using normal distribution

Who this book is for

This book is intended for people who wish to expand their knowledge of statistics and data analysis via real-world examples. A basic understanding of the Haskell language is expected. If you are feeling brave, you can jump right into the functional programming style.

Frequently asked questions

How do I cancel my subscription?
Simply head over to the account section in settings and click on “Cancel Subscription” - it’s as simple as that. After you cancel, your membership will stay active for the remainder of the time you’ve paid for. Learn more here.
Can/how do I download books?
At the moment all of our mobile-responsive ePub books are available to download via the app. Most of our PDFs are also available to download and we're working on making the final remaining ones downloadable now. Learn more here.
What is the difference between the pricing plans?
Both plans give you full access to the library and all of Perlego’s features. The only differences are the price and subscription period: With the annual plan you’ll save around 30% compared to 12 months on the monthly plan.
What is Perlego?
We are an online textbook subscription service, where you can get access to an entire online library for less than the price of a single book per month. With over 1 million books across 1000+ topics, we’ve got you covered! Learn more here.
Do you support text-to-speech?
Look out for the read-aloud symbol on your next book to see if you can listen to it. The read-aloud tool reads text aloud for you, highlighting the text as it is being read. You can pause it, speed it up and slow it down. Learn more here.
Is Getting Started with Haskell Data Analysis an online PDF/ePUB?
Yes, you can access Getting Started with Haskell Data Analysis by James Church in PDF and/or ePUB format, as well as other popular books in Computer Science & Data Modelling & Design. We have over one million books available in our catalogue for you to explore.

Information

Year
2018
ISBN
9781789808605
Edition
1

Descriptive Statistics

In this book, we are going to learn about data analysis from the perspective of the Haskell
programming language. The goal of this book is to take you from being a beginner in math
and statistics, to the point that you feel comfortable working with large-scale datasets.
Now, the prerequisites for this book are that you know a little bit of the Haskell
programming language, and also a little bit of math and statistics. From there, we can start
you on your journey of becoming a data analyst.
In this chapter, we are going to cover descriptive statistics. Descriptive statistics are used to summarize a collection of values into one or two values. We begin with learning about the Haskell Text.CSV library. In later sections, we will cover in increasing difficulty the range, mean, median, and mode; you've probably heard of some of these descriptive statistics before, as they're quite common. We will be using the IHaskell environment on the Jupyter Notebook system.
The topics that we are going to cover are as follows:
  • The CSV library—working with CSV files
  • Data ranges
  • Data mean and standard deviation
  • Data median
  • Data mode

The CSV library – working with CSV files
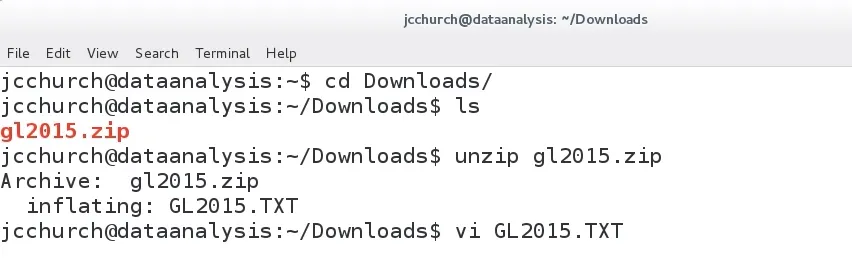
In this section, we're going to cover the basics of the CSV library and how to work with CSV files. To do this, we will be taking a closer look at the structure of a CSV file; how to install the Text.CSV Haskell library; and how to retrieve data from a CSV file from within Haskell.
Now to begin, we need a CSV file. So, I'm going to tab over to my Haskell environment, which is just a Debian Linux virtual machine running on my computer, and I'm going to go to the website at retrosheet.org. This is a website for baseball statistics, and we are going to use them to demonstrate the CSV library. Find the link for Data Downloads and click Game Logs, as follows:
Now, scroll down just a little bit and you should see game logs for every single season, going all the way back to 1871. For now, I would like to stick with the most recent complete season, which is 2015:
So, go ahead and click the 2015 link. We will have the option to download a ZIP file, so go ahead and click OK. Now, I'm going to tab over to my Terminal:
Let's go into the Downloads folder, and if we hit ls, we see that there's our ZIP file. Let's unzip that file and see what we have. Let's open up GL2015.TXT. This is a CSV file, and will display something like the following:
A CSV file is a file of comma-separated values. So, you'll see that we have a file divided up, where each line in this file is a record, and each record represents a single game of baseball in the 2015 season; and inside every single record is a listing of values, separated by a comma. So, the very first game in this dataset is a game between the St. Louis Cardinals—that's SLN—and the Chicago Cubs—that's CHN—and this game took place on March 5th 2015. The final score of this first game was 3-0, and every line in this file is a different game.
Now, CSV isn't a standard, but there are a few properties of a CSV file which I consider to be safe. Consider the following as my suggestions. A CSV file should keep one record per line. The first line should be a description of each column. In a future section, I'm going to tell you that we need to remove the header line; and you'll see that this particular file doesn't have this header line. I still like to see the description line for each column of values. If a field in a record includes a comma, then that field should be surrounded by double quote marks. Now we don't see an example of this—at least, not on this first line—but we do see examples of many values having quote marks surrounding the file, such as the very first value in the file, the date:
In a CSV file, if a field is surrounded by quote marks, then it is optional, unless it has a comma inside that value. While we're here, I would like to make a note of the tenth column in this file, which contains the number 3 on this particular row. This represents the away-team score in every single record of this file. Make a note that our first value on the tenth column is a 3—we're going to come back to that later on.
Our next task is installing the Text.CSV library; we do this using the Cabal tool, which connects with the Hackage repository and downloads the Text.CSV library:
The command that we use to start the install, shown in the first line of the preceding screenshot, is cabal install csv. It takes a moment to download the file, but it should download and install the Text.CSV library in our home folder. Now, let me describe what I currently have in my home folder:
I like to create a directory for my code called Code; and inside here, I have a directory called HaskellDataAnalysis. And inside HaskellDataAnalysis, I have two directories, called analysis and data. In the analysis folder, I would like to store my notebooks. In the data folder, I would like to store my datasets.
That way, I can keep a clear distinction between analysis files and data files. That means I need to move the data file, just downloaded, into my data folder. So, copy GL2015.TXT from our Downloads folder into our data folder. If I do an ls on my data folder, I'll see that I've got m...

Table of contents