![]()
Chapter 1
Organisation, Structure and Methodology
1.1WHY THIS BOOK AND FOR WHOM
In the tradition of the Asia Competitiveness Institute (ACI) at the Lee Kuan Yew School of Public Policy (LKYSPP), National University of Singapore (NUS), our work and publications make a distinctive contribution to the literature, firstly by focusing on competitiveness analysis and ranking at sub-national levels, over and above traditional analysis at national levels.
Secondly, it is in this spirit that we at the ACI have crafted a comprehensive methodology (the details of which are covered in the next section of this chapter) to assess annual competitiveness at the sub-national level. This methodology is employed here in this book, and in ACI’s previous publications reporting research findings on Greater China, Indonesia, India and ASEAN countries (Tan et al. 2013; Tan et al. 2013; Tan et al. 2013a, 2013b; Tan et al. 2014).
Since the inaugural volume of the Annual Analysis of Competitiveness, Simulation Studies and Development Perspective for 34 Greater China Economies: 2000–2010 (Tan et al. 2014), the comprehensive competitiveness index developed by ACI has been used to rank the 34 Greater China economies in various dimensions. As ACI aims to provide an update on findings of all studies, this updated book thus includes data from 2000 to 2012 for 34 Greater China Economies.
ACI’s evidence-based analysis, which is supported by quantitative methodologies, offers great value for policymakers, academicians, experts, practitioners and players in business and nongovernmental organisations, all of whom are among ACI’s target audience. Following the academic tradition of multidisciplinary and cross-border dialogues among stakeholders, ACI holds Review Seminars prior to any book publication. As noted in the Acknowledgements, the Review Seminar on Provincial and Regional Competitiveness Analysis for Greater China was held in LKYSPP, NUS on 28th August 2015.
This book, comprising five chapters, has this introductory chapter as a road map for readers. Chapter 2 details the 2015 Annual Update on Competitiveness Ranking and Simulation Studies for 34 Greater China Economies. Chapter 3 features the results of the 2015 Regional Competitiveness Analysis on the five regions of Greater China, namely Eastern Coastal Area of China, Central China, Western China, Northeastern China and Hong Kong, Macau and Taiwan. In Chapter 4, we report the results of the analysis on the Agricultural Productivity in Greater China Economies, which focuses on studying the provincial agricultural Total Factor Productivity (TFP) in mainland China. Chapter 5 concludes our views on China’s future growth prospect and the way forward towards an innovation-driven economy for Greater China. Potential research agenda by ACI is also highlighted in this chapter. Three appendices feature ACI’s list of indicators for provincial level economies, the algorithm for competitiveness analysis, and ACI’s regional competitiveness list of indicators with notes on data aggregation method.
The rest of Chapter 1 is organised as follows. Section 1.2 details the methodology and data used to derive the competitiveness rankings. It also includes the approach adopted by ACI to conduct policy-induced simulation analysis on the 34 Greater China economies, to allow for improvements in competitiveness on various dimensions. This makes the contribution much more constructive than other indices that merely report rankings.
1.2METHODOLOGY AND DATA SOURCES
1.2.1Literature Review on Competitiveness
The notion of regional or in situ competitiveness has been explored in various ways. Initially, in the 1980s, the term “competitiveness” was considered as part of the private sector domain, especially in relation to firms performance (Porter 1980). Over time, the discourse expanded onto the domain of macroeconomics, as shown by the establishment of “Council on Competitiveness” or similar institution in various advanced industrialised countries. Some scholars acknowledge that it is primarily firms that compete, not nations, regions or places (Krugman 1994). However, the performance of firms depends on various factors that are embedded in the firm’s location. These include quality of labour and infrastructure, governance, costs of doing business, as well as the performance of competing and complementary firms around the area (Bristow 2010; Camagni 2002; Kitson, Martin and Tyler 2004).
Two of the most highly cited cross-country competitiveness studies at the moment are the World Competitiveness Yearbook (WCY) and the Global Competitiveness Report (GCR). The WCY defines competitiveness as composed of four factors: (1) economic performance, (2) government efficiency, (3) business efficiency and (4) infrastructure. Each factor is further made up of five criteria, so that there are 20 criteria in total. The WCY uses equal weights such that each criterion contributes 5% weight, and each factor contributes 25% weight to the overall competitiveness index (World Competitiveness Center 2014). Most of the data used are statistical indicators sourced from international, regional and national organisations. Substantial perception data sourced from executive surveys also supplement the statistical data.
The GCR breaks down its Global Competitiveness Index into three sub-indices: (1) basic requirements, (2) efficiency enhancers and (3) innovation and sophistication factors (World Economic Forum 2014). Each of the three sub-indices has a different number of pillars. The basic requirements sub-index has four pillars: institutions, infrastructure, macroeconomic environment and health and primary education. The efficiency enhancers sub-index is composed of six pillars: higher education and training, goods market efficiency, labour market efficiency, financial market development, technological readiness and market size. Lastly, the innovation and sophistication factors sub-index consists of two pillars: business sophistication and innovation. Most of the data that make up these pillars and sub-indices come from executive opinion surveys.
1.2.2Four Environments and 11 Sub-Environments
Our approach to competitiveness is comprehensive because it takes into account different factors that collectively shape the ability of an economy to achieve substantial and inclusive economic development over a sustainable period of time.
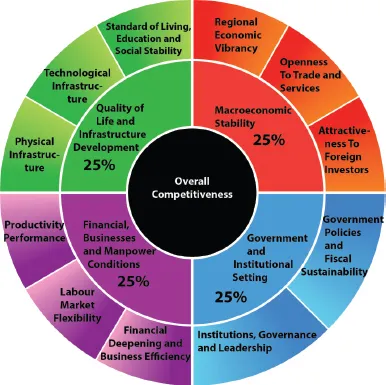
Guiding this overarching context, ACI has defined competitiveness according to four environments: (1) Macroeconomic Stability, (2) Government and Institutional Setting, (3) Financial, Businesses and Manpower Conditions and (4) Quality of Life and Infrastructure Development. These four environments have the same impact on Overall Competitiveness, wherein each environment counts for 25% of Overall Competitiveness score (see Figure 1.1).
ACI’s competitiveness framework also uses a nested approach, creating two to three sub-environments under each of the four environments. There are a total of 11 sub-environments for the 34 Greater China economies. Each sub-environment within each environment is given equal influence as the others under the same environment.
ACI uses a simple averaging mechanism to integrate all sub-environments (each is given the same weight) into their respective environment. Thereafter, all environments are combined into an Overall Competitiveness ranking. While assigning different weight to each environment, sub-environment and indicator based on their importance may be more appropriate, the implementations are controversial. Therefore, to achieve a balanced view for each factor of Overall Competitiveness, equal weights are assigned.
Figure 1.1: ACI’s Competitiveness Framework
Source: Asia Competitiveness Institute
The ACI competitiveness framework, with its four environments, is a comprehensive and systematic way of examining competitiveness. Two of these environments are directly linked to the economy. Macroeconomic Stability expresses aggregate economic activity and includes three sub-environments: (1) Regional Economic Vibrancy, (2) Openness to Trade and Services and (3) Attractiveness to Foreign Investors. Regional Economic Vibrancy includes data on an economy’s Gross Regional Domestic Product (GRDP), value-addedness of the three economic sectors, Consumer Price Index (CPI), tourism and investment. Openness to Trade and Services goes further to examine how international an economy is, taking into consideration the position of its merchandise on the international market as well as the performance of trade and tourism. Attractiveness to Foreign Investors includes the state of foreign direct investment and foreign-funded companies that are active in a particular economy.
Financial, Businesses and Manpower Conditions mainly looks at the microeconomic state of the economy, examining its financial strength and understanding the factors that can affect a company’s productivity, especially labour force. This environment includes three sub-environments: (1) Financial Deepening and Business Efficiency, (2) Labour Market Flexibility and (3) Productivity Performance. Financial Deepening and Business Efficiency reflects the state of financing and investment in economic activities in an economy. Labour Market Flexibility includes data on employment and wages. Productivity Performance includes the value-added productivity per worker for each of the three economic sectors, investment in fixed asset and overall labour productivity.
The other two environments are identified as Government and Institutional Setting and Quality of Life and Infrastructure Development. Government and Institutional Setting includes the fiscal state of government and economic structure of a particular economy. This environment includes two sub-environments: (1) Government Policies and Fiscal Sustainability and (2) Institutions, Governance and Leadership. Government Policies and Fiscal Sustainability examines the expenses, revenue and tax collection for each economy. Institutions, Governance and Leadership looks at the corporate structure of an economy to measure how market-oriented it is. Data used include that for domestically funded enterprises, state-owned enterprises, collective-owned enterprises, limited liability corporations, joint-stock companies, private enterprises and foreign funded enterprises.
Finally, Quality of Life and Infrastructure Development takes an overall view of basic infrastructure and public services as well as the overall quality of life. The three sub-environments under this environment include: (1) Physical Infrastructure, (2) Technological Infrastructure and (3) Standard of Living, Education and Social Stability. Physical Infrastructure mainly refers to the level of development in an economy in terms of transportation (railways, highways, navigable inland waterways, and civil aviation routes). Among the 34 Greater China economies, several economies lag further behind others due to geographical factors. For example, neither Beijing nor Tibet has navigable inland waterways. For such economies, data has been assigned as zero. In addition to transportation, Physical Infrastructure also includes the production levels of natural resources (for example, coal, oil and iron) of an economy. Similar to transportation data, some of these values may also be zero depending on the kind of natural resources each economy has. For instance, Hainan and Tibet produce very little coal. We have done our best to collect a range of transportation and natural resource data to reflect as accurately, the advantages and disadvantages of each economy. Technological Infrastructure generally includes information and communications technology (ICT) such as personal computers, televisions, fixed telephones, mobile telephones, internet access and patents. Meanwhile, healthcare, education, population structure and the state of the environment are all included in the Standard of Living, Education and Social Stability sub-environment.
1.2.3Indicators
There are a total of 102 indicators used in the competitiveness ranking of the 34 Greater China economies. The availability of data is greater...