Compare global experiences during the balance sheet recession and find out what is needed for a full recovery
The Escape from Balance Sheet Recession and the QE Trap details the many hidden dangers remaining as the world slowly recovers from the balance sheet recession of 2008. Author and leading economist Richard Koo explains the unique political and economic pitfalls that stand in the way of recovery from this rare type of recession that was largely overlooked by economists. Koo anticipated the current predicament in the West long before others and issued warnings in his previous books: Balance Sheet Recession and The Holy Grail of Macroeconomics. This new book illustrates how history is repeating itself in Europe while the United States, which learnt from the Japanese experience, is doing better by avoiding the fiscal cliff. However, because of the liberal dosage of quantitative easing already implemented, the United States, the United Kingdom, and Japan may face a treacherous path to normalcy in what Koo calls the QE Trap. He argues that it is necessary to understand balance sheet recession in order to resolve the Eurozone crisis, particularly the competitiveness problems. Koo issues warnings against those who are too ready to argue for structural reforms when the problems are actually with balance sheets. He re-examines Japan's two decades of experiences with this rare recession and offers an insider view on the Abenomics. On China, readers will gain a very different historical perspective as Koo argues that western commentators have forgotten their own history when they talk about the re-balancing of the Chinese economy.
Learn from Japan which experienced the same predicament afflicting the West fifteen years earlier
Discover how unwinding of quantitative easing will affect the United States, the United Kingdom, Japan, as well as the emerging world
Examine solutions to the Eurozone problems caused by two balance sheet recessions eight years apart
Gain insight into China's problems from the West's own experiences with urbanisation
Koo, who developed the concept of balance sheet recession based on Japan's experience, took the revolution in macroeconomics started by John Maynard Keynes in 1936 to a new height. The Escape from Balance Sheet Recession and the QE Trap offers the world cure for balance sheet recession.
Trusted by 375,005 students
Access to over 1.5 million titles for a fair monthly price.
The greatest similarity between the Western economies today and the Japanese economy of 20 years ago is that both experienced the collapse of a massive, debt-financed bubble. Balance sheet recessions occur only when a nationwide asset bubble financed by debt bursts. Since nationwide debt-financed bubbles occur only rarely, balance sheet recessions are few and far between.
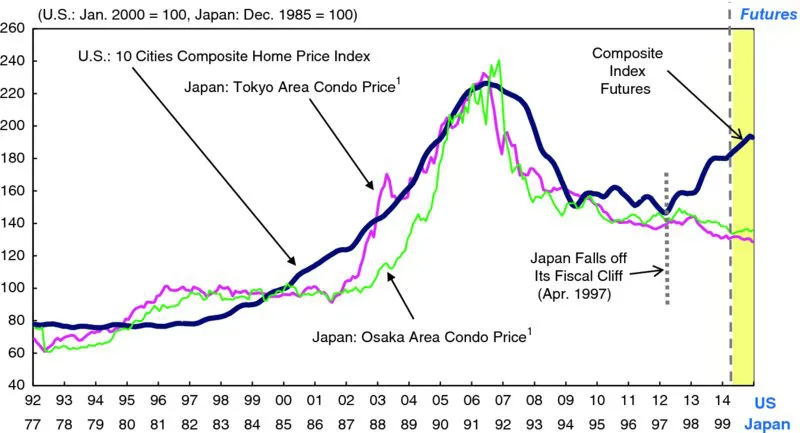
Figure 1.1 compares conditions in the U.S. housing market with those in Japan 15 years earlier. As the graph shows, the two markets trod identical paths in terms of the magnitude of the increase in prices, the duration of that increase, the magnitude of the subsequent decline in prices, and the duration of that decline. In other words, the United States can now expect to face the same set of conditions that Japan once did. The situation in Europe is similar (Figure 1.2).
Figure 1.1 The U.S. Housing Bubble Comparable to the Japanese Housing Bubble 15 Years Earlier
Note: Per m2, five-month moving average
Sources: Bloomberg; Real Estate Economic Institute, Japan; S&P, S&P/Case-Shiller® Home Price Indices, as of June 6, 2014.
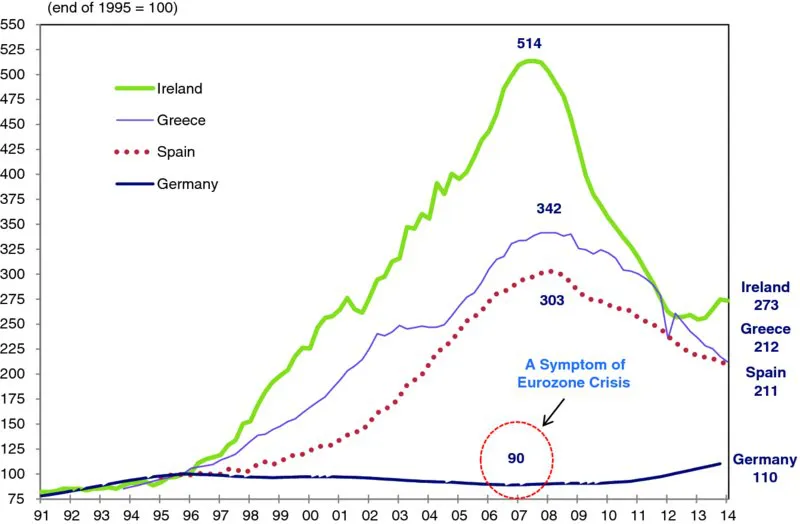
Figure 1.2 Europe's Experiences with House Price Bubbles
Notes: Ireland's figures before 2005 are existing house prices only. Greece's figures are flats' prices in Athens and Thessaloniki.
Source: Nomura Research Institute (NRI), calculated from Bank for International Settlements (BIS) data.
Europe's housing bubbles and the subsequent collapse were even larger in scale. In Ireland, for instance, house prices rebased to 100 in 1995 rose to 514 by 2007 before falling back to 273 today. Similar price spikes occurred in Greece, Spain, and other Eurozone countries. Germany was the sole exception. Although the Germans operated under the same monetary policy and low interest rates as other members of the Eurozone, they did not experience an asset price bubble—in fact, house prices fell significantly, as the bottom line in Figure 1.2 demonstrates. When prices are rebased to 100 in 1995, German house prices had slipped to 90 in 2006. This lack of synchronicity between Germany and other Eurozone economies was a major contributor to the recent euro crisis, something that will be discussed in detail in Chapter 5.
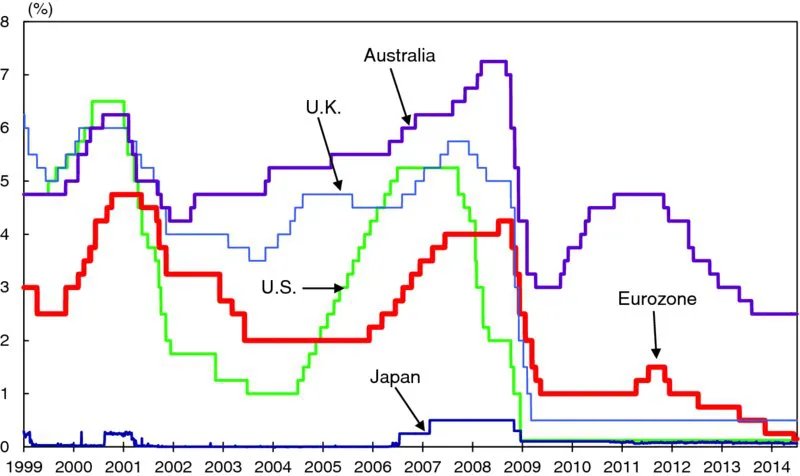
Central banks responded to these burst bubbles and the economic weakness that followed by lowering interest rates dramatically. In the United States, the Fed cut rates at the fastest pace in its history, taking short-term rates down to zero by late 2008. The Bank of England (BOE), the European Central Bank (ECB), and the Reserve Bank of Australia also slashed rates (Figure 1.3).
Figure 1.3 Drastic Interest Rate Cuts Had Little Effect on Economies
Sources: Bank of Japan (BOJ), Federal Reserve Board (FRB), European Central Bank (ECB), Bank of England (BOE), and Reserve Bank of Australia (RBA) (as of June 4, 2014).
However, the reaction of these economies to the rate cuts has been muted at best—and this despite the fact that the United States, United Kingdom, and European interest rates have been at all-time lows for more than five years.
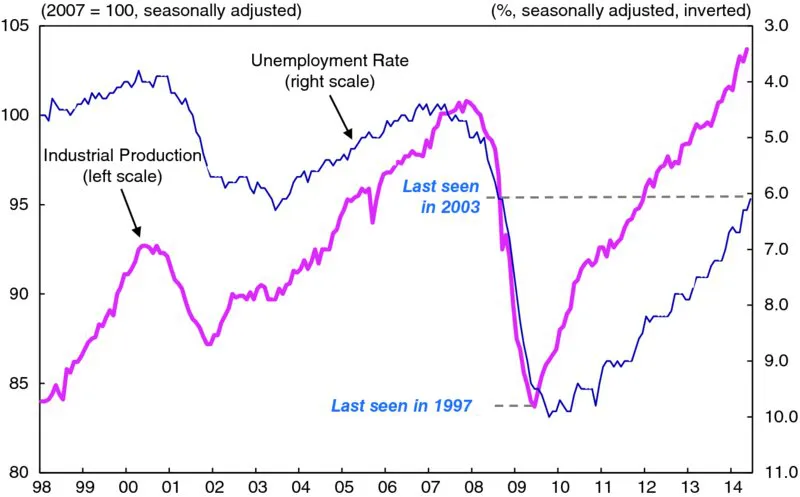
Figure 1.4 shows U.S. industrial output and the unemployment rate. In spite of zero interest rates and the Fed's massive quantitative easing (QE) program, industrial production has only recently recovered to the levels of the 2007 peak. The unemployment rate, meanwhile, remains at an elevated level, reflecting stubbornly weak labor market conditions.
Figure 1.4 The United States Regains Bubble-Peak Industrial Production after a Six-Year Period
Sources: U.S. Department of Labor; FRB.
The U.S. labor market has traditionally held a reputation for flexibility. The ease with which companies could shed employees during economic downturns was responsible for the economy's relatively high sensitivity to interest rates—a measure of the speed with which it reacts to changes in interest rates—since businesses could respond swiftly to changes in rates and other external factors. An unemployment rate of over 6 percent after five years of zero interest rates is unprecedented.
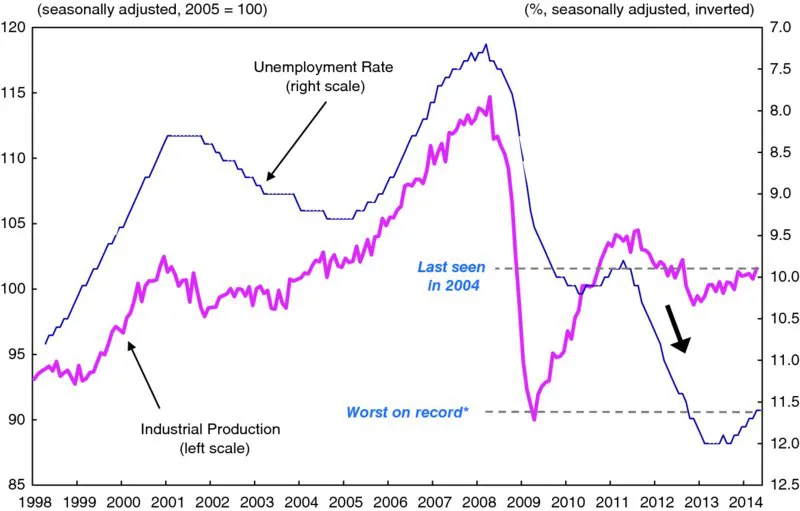
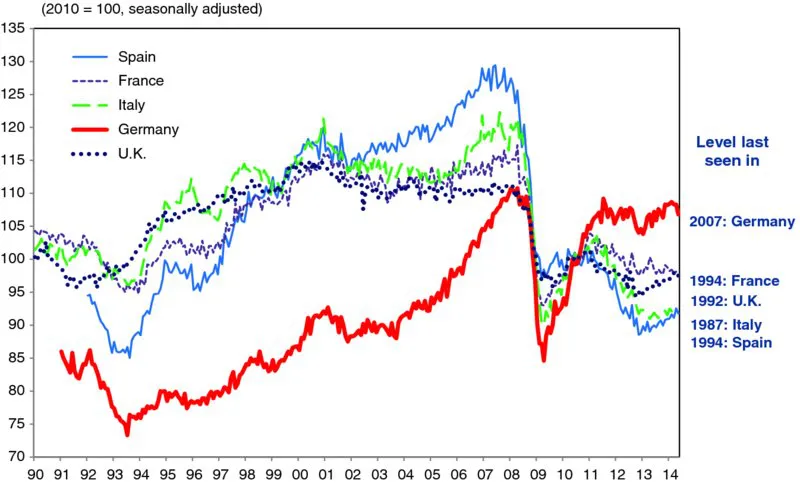
Similar conditions can be observed in the Eurozone. Industrial output there has only just recovered to the levels of 2004, while the unemployment rate remains in double-digit territory at 11.6 percent (Figure 1.5). Although the ECB has taken interest rates down to an all-time low of 0.15 percent, Europe's unemployment rate is at a post-1998 high. And in certain countries conditions are even worse. As Figure 1.6 shows, industrial production in France and Spain remains stuck at the levels of 1994, and in Italy output is no higher than it was in 1987. Spain has an unemployment rate of 25.1 percent, similar to the levels seen in the United States during the Great Depression. And with unemployment running at 10.1 percent in France and 12.6 percent in Italy, a recovery is still far off. Germany, which is responsible for about one third of Eurozone gross domestic product (GDP), is the exception, with industrial output having recovered to the levels of 2007 and approaching an all-time high. The unemployment rate there is also running at 5.1 percent, the lowest level since comparable statistics began in 1991.
Figure 1.5 Bursting of the Housing Bubble Weakens Eurozone Economies
*No data before 1998.
Source: Eurostat.
Figure 1.6 Industrial Production in Europe
Sources: Eurostat; Office for National Statistics U.K. (ONS).
GDP and Inflation Fueled by Growth in Money Supply, Not Monetary Base
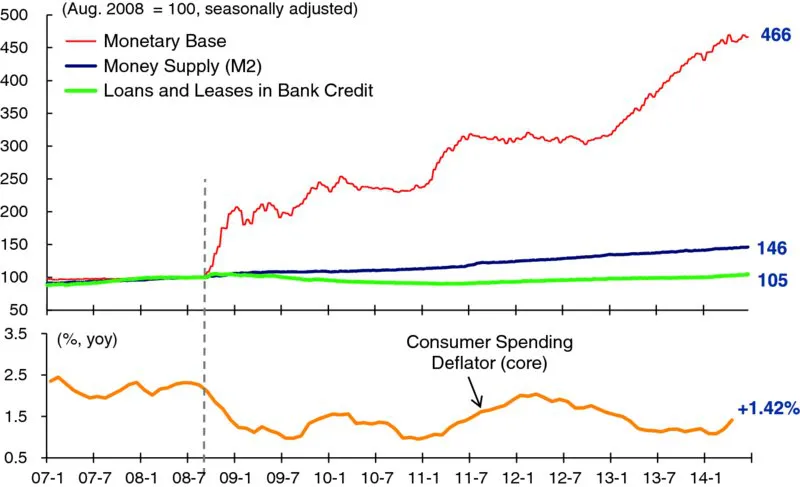
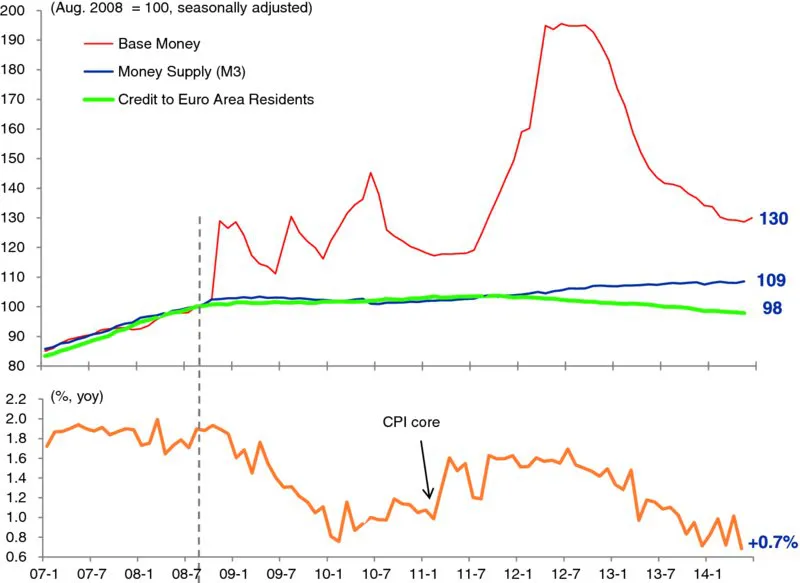
Industrial output and employment are not the only key indicators that have yet to recover. The money supply and private credit in these countries have hardly grown at all in spite of sharply lower interest rates and quantitative easing (QE). Figures 1.7 to 1.10 show three key monetary indicators: the monetary base, or base money, which tells us how much liquidity the central bank has supplied; the money supply, which indicates how much money is actually available for use by the private sector; and private credit, which shows how much the private sector has borrowed (in the United States, this is defined as total outstanding commercial bank loans and leases). It is important to look at all three because central banks can always supply liquidity (base money) by buying government or corporate bonds from private financial institutions. But for those funds to leave the financial sector, banks must lend them to someone in the real economy (private credit). In other words, liquidity (base money) provided by the central bank will stay in the banking system unless private financial institutions extend more credit to private borrowers.
Figure 1.7 Drastic Liquidity Injections Resulting in Minimal Increases in Money Supply and Credit: United States
Note: Commercial bank loans and leases, adjustments for discontinuities made by NRI.
Sources: FRB; U.S. Department of Commerce.
Figure 1.8 Drastic Liquidity Injections Resulting in Minimal Increases in Money Supply and Credit: Eurozone
Note: Base money's figures are seasonally adjusted by NRI.
Sources: ECB; Eurostat.
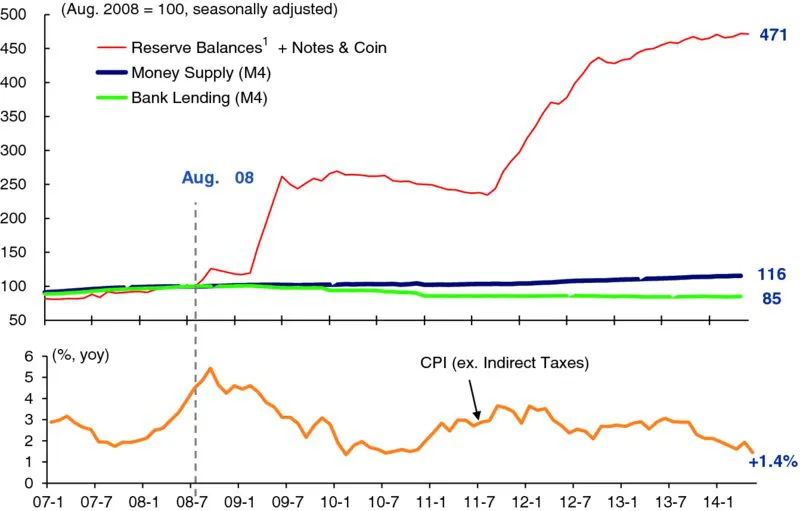
Figure 1.9 Drastic Liquidity Injections Resulting in Minimal Increases in Money Supply and Credit: U.K.
Notes: 1. Reserve Balances data are seasonally unadjusted. 2. Money supply and bank lending data exclude intermediate financial institutions.
Sources: BOE; ONS.
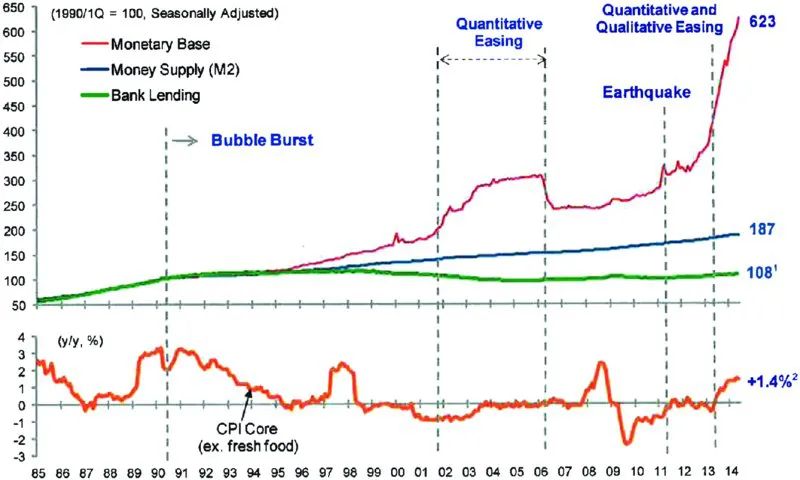
Figure 1.10 Drastic Liquidity Injections Resulting in Minimal Increases in Money Supply and Credit: Japan
Notes: 1. Figures for bank lending are seasonally adjusted by NRI. 2. Excluding the impact of consumption tax.
Source: BOJ.
The money supply, an indicator of how much money is available for the private sector to use, is mostly made up of bank deposits. Economists watch the money supply closely because it tends to be closely correlated with the inflation rate and nominal GDP. There are numerous definitions of the money supply ranging from M1 to M4, and their usefulness as indicators varies from one economy to the next. Figures 1.7 to 1.10 use the money supply definition considered most useful by the central bank in each country.
Traditional economics teaches that these three indicators should move together. In other words, a 10 percent increase in the monetary base should ultimately lead to a 10 percent increase in the money supply and a 10 percent increase in private credit. That rule was largely valid in the pre-Lehman textbook world, when the three lines moved more or less together.
But this correlation between the three indicators has broken down completely in the post-Lehman world. The level of liquidity in the system, rebased to 100 at the time of the Lehman failure, rose to 466 as the Fed supplied liquidity under QE. Under ordinary circumstances this would cause both the money supply and private credit to increase from 100 to 466. Yet as Figure 1.7 shows, the money supply has grown to only 146, and private credit has barely recovered to pre-Lehman levels at 105. In other words, these indicators have completely decoupled. Some academics and pundits argue that the economy would improve if only the central bank would turn up the dials on the printing press, but the only aggregate the printing press can influence directly is the monetary base. It is the money supply and private credit, indicators of money available for private-sector use, that have a direct impact on GDP and inflation.
Monetary policy is effective if central bank accommodation increases money and credit for the private sector to use. In the United States, however, there has been little growth in either private credit or the money supply. As a result, U.S. inflation has slowed even after three rounds of quantitative easing by the Fed, as shown by the bottom line in Figure 1.7. That we have not seen a more pronounced economic recovery and an acceleration of inflation is attributable to the absence of growth in private credit and the money supply.
The same phenomenon can be observed in Europe. Figure 1.8 shows that these three indicators moved largely in line with each other until Lehman went bankrupt. Subsequently, growth in both private credit and the money supply has been modest at best in spite of massive base money expansion and repeated ECB rate cuts.
Figure 1.9 shows that in the United Kingdom as well, the three indicators moved largely in tandem prior to the collapse of Lehman and the Bank of England's massive QE program. Readers may remember the boast by Paul Fisher, BOE's executive director for markets, that the Bank would not repeat Japan's mistakes and would engage in bold quantitative easing to boost the money supply and drive an economic recovery. Those of us in Japan sat back and waited to see if the BOE could do what Bank of Japan (BOJ) could not do, but in the end the U.K. money supply did not grow at all. Bank lending—that is, private credit—actually shrank, and continued shrinking. The mone...
CHAPTER 2 Monetary Policy and the Quantitative Easing Trap
CHAPTER 3 The United States in Balance Sheet Recession
CHAPTER 4 The Great Potential of Abenomics
CHAPTER 5 Euro Crisis—Facts and Resolution
CHAPTER 6 China's Economic Challenges
Afterword
Bibliography
Index
End User License Agreement
Frequently asked questions
Yes, you can cancel anytime from the Subscription tab in your account settings on the Perlego website. Your subscription will stay active until the end of your current billing period. Learn how to cancel your subscription
No, books cannot be downloaded as external files, such as PDFs, for use outside of Perlego. However, you can download books within the Perlego app for offline reading on mobile or tablet. Learn how to download books offline
Perlego offers two plans: Essential and Complete
Essential is ideal for learners and professionals who enjoy exploring a wide range of subjects. Access the Essential Library with 800,000+ trusted titles and best-sellers across business, personal growth, and the humanities. Includes unlimited reading time and Standard Read Aloud voice.
Complete: Perfect for advanced learners and researchers needing full, unrestricted access. Unlock 1.5M+ books across hundreds of subjects, including academic and specialized titles. The Complete Plan also includes advanced features like Premium Read Aloud and Research Assistant.
Both plans are available with monthly, semester, or annual billing cycles.
We are an online textbook subscription service, where you can get access to an entire online library for less than the price of a single book per month. With over 1.5 million books across 990+ topics, we’ve got you covered! Learn about our mission
Look out for the read-aloud symbol on your next book to see if you can listen to it. The read-aloud tool reads text aloud for you, highlighting the text as it is being read. You can pause it, speed it up and slow it down. Learn more about Read Aloud
Yes! You can use the Perlego app on both iOS and Android devices to read anytime, anywhere — even offline. Perfect for commutes or when you’re on the go. Please note we cannot support devices running on iOS 13 and Android 7 or earlier. Learn more about using the app
Yes, you can access The Escape from Balance Sheet Recession and the QE Trap by Richard C. Koo in PDF and/or ePUB format, as well as other popular books in Economía & Finanzas. We have over 1.5 million books available in our catalogue for you to explore.