![]()
CHAPTER 1
Introduction to Swing Trading
Swing trading reminds me of standing on the shore of an ocean, watching the waves. Each wave has a crest and trough—a swing from high to low or low to high that mimics the up and down motion of stocks. Swing traders do not try to surf that wave by riding near the crest, but by sailing their boat from trough to crest like in scenes from The Perfect Storm.
WHAT IS SWING TRADING?
There are two types of swing trading styles. The first is to range trade, that is, buy and sell as price bounces between a low and high price. If you know what a rectangle chart pattern is or a channel, then you can buy near the bottom and sell near the top repeatedly. I find that the profit potential of range trading is not exciting enough for me.
- Range trading is buying and selling as price bounces between highs and lows.
I prefer to catch a swing as soon as it starts and hold it until it ends. It is the same idea as a range trade but the high–low range is often much larger (if you are lucky) and you only trade it once.
- A trend trade buys near the swing low and sells near the end of a short-term trend (or the reverse: sell high and buy low).
Swing trading is trying to catch price as it moves between peaks and valleys. Another way to say this is that swing trading is capturing the move between layers of support and resistance.
Why not just hold onto the stock and ride it? You can do that, of course, but swing traders believe that they can increase profits by participating as the stock oscillates up and down like waves on a pond.
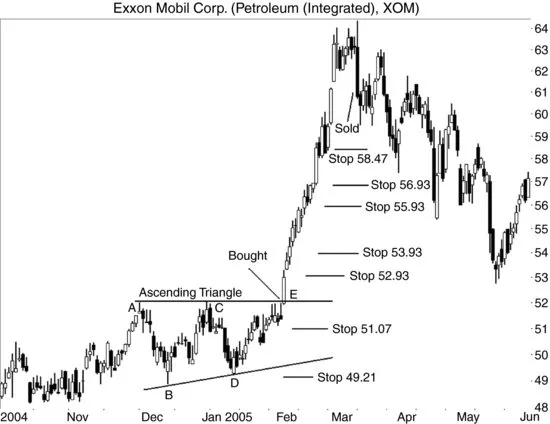
Look at Figure 1.1. If investors bought the stock at A and sold it at E, they would have made almost nothing since price did not change between those two points. However, perfect swing traders would sell short at A, cover at B and buy long, sell at C and go short, and so on, profiting from each swing of the stock. They could have captured roughly $3 per share on each of the AB and BC moves, and $2 on each of the CD and DE moves for a total of $10 per share. That is not bad for a stock that ends where it begins.
WHO SHOULD SWING TRADE?
As the hold time for a trade shortens, there is less room for error. You can ignore a stock for years using a buy-and-hold strategy and still turn a profit. With swing trading, a trader’s skills need to identify turning points with accuracy. One mistake can be costly, which is why stop placement is important.
Swing trading demands a different personality than the longer hold time brethren. While a buy-and-hold investor watches autumn leaves changing color on the back porch, a day trader is injecting caffeine and hanging onto the computer desk, knuckles white. A swing trader is not as nervous as a day trader, but you get my point. Swing traders have to pay closer attention to their trades than do those with a longer hold time horizon.
One novice swing trader I know waits for his favorite stocks to drop by 20 percent before he buys. Then he closes his eyes and waits for them to recover, hoping for a 30 percent move before he cashes out. He turned an investment of $25,000 into almost $100,000 in a year using this simple idea.
He has three keys to success. First, he chooses to ignore mistakes. If the stock continues to drop, it turns into a buy-and-wait-for-recovery trade, praying for breakeven. Second, the stocks were also cheap, in the $2 to $4 range (like Citigroup) with high volatility. In the days of the banking crisis (2009), he could peel off a 30 percent gain in about three days, but would become trapped in a loser for weeks. Fortunately for him, his picks recovered and allowed him to minimize losses. Third, the banking industry was in turmoil, making large swings every few days, catering to his trading setup.
He enjoys this fast-paced trading action. It is not day trading, so he can still monitor his stocks a few times each day from his day job without getting into trouble. Recently, though, the setup has not been working as well as in the past. He has moved from banking stocks to housing stocks, and those do not bounce around as much. Any recovery for a losing position now takes not weeks but months.
- Swing trading is best suited for people who are accustomed to using stops and like to follow the market daily.
A SWINGING EXAMPLE
Perfect trades are rare, but I have made a surprising number. I am not claiming to be a perfect trader—not by a long shot—but the timing on some of them is well done. A trade in Exxon Mobil Corp. (XOM) is a particularly good example of a nearly perfect swing trade. Figure 1.1 shows the setup.
On one of the passes through the nearly 700 securities that I look at, I spotted a rare bird: an ascending triangle. Normally I dislike trading ascending triangles because price rises 5 to 10 percent before reversing.
I logged the ascending triangle into my database two days before the breakout and then started my research. After looking at other stocks in the industry, I concluded that the oils were boiling, and I wanted to participate. I placed a buy stop at 52.06, which is a penny above the top of the triangle.
I scored the chart pattern and this one had a –1 score, meaning it was unlikely to reach the 65.91 price target.
Using the height of the chart pattern projected a more conservative target of 55.20, a gain of about three points over the expected fill price. I will explain the measure rule for calculating price targets in Chapter 3 (under the heading “Measuring Swings”).
The company released earnings the day before the breakout. The next day (E), the buy stop filled a penny higher because price blew the lid off the top of the ascending triangle.
I always assume a throwback will occur, but it did not. Price just kept on rising. After entering the trade, I placed a stop at 49.21 that same day. I positioned the stop below the bottom of the chart pattern using the minor low (D) at the start of January as the reference.
As price climbed, I raised the stop as the chart shows, to 51.07. On February 10, I raised the stop to 52.93, using a 62 percent Fibonacci retrace of the move up from January 28 low (51.11, two days before the breakout) to the current high of 56.62, minus about 25 cents.
On February 16, I raised the stop to 53.93, again using a 62 percent Fibonacci retrace to price the stop. Two days later, I wrote in my notebook: “Stop raised to 55.93. I am getting nervous about the straight-line run, so I am tightening up the stop. A quick decline often follows a quick rise, so. . . .”
I continued to raise the trailing stop and ended with it at 61.15. However, in a late-day sell off, the stock blew through my stop and filled at 60.90.
On the day I sold, the stock reached a new high of 64.37, fulfilling the scoring system’s prediction that it would not reach 65.91.
Selling was the right move since the stock tumbled back to a low of 52.78 in less than three months. I captured a dividend payment during the hold time, giving me a net gain of 17 percent.
Why do I consider this a perfect swing trade? Entry was within 2 cents of the optimum breakout price and the stock peaked on the day I sold. Yes, the stop cashed me out near the low for the day, but that happens sometimes. Seeing the stock tumble after I sold gave me a warm feeling inside, but it could have been the jalapeños I ate.
- The ExxonMobil trade started with the breakout from an ascending triangle and ended using a stop.
LOOKING AHEAD
The pages that follow discuss the techniques that I use to swing trade and some tips from others. Since I like chart patterns, I will discuss event patterns and how you can profit from them. Those can be quite important for swing traders because the patterns have an opportunity to repeat periodically (such as every quarter).
The inverted dead-cat bounce is one of my favorites. Not only do you cash out when price shoots up, but you cannot beat the feeling of price confirming it by tumbling after you exit.
The event pattern is an easy way to capture profits. Sometimes price continues rocketing skyward after you sell, but the probabilities suggest a return to earth. I have developed a fondness for parachutes instead of moon shots. Perhaps you will, too, after reading about the inverted dead-cat bounce.
I have discussed busted chart patterns but they deserve another look. They represent a low-risk, high-success setup, and in Chapter 3 I discuss how to profit when you see them.
CHAPTER CHECKLIST
Range trading is buying and selling as price bounces between highs and lows. See “What Is Swing Trading?”
A trend trade buys near the swing low and sells near the end of a short-term trend (or the reverse: sell high and buy low). See “What Is Swing Trading?”
Swing trading is best suited for people who are accustomed to using stops and like to follow the markets daily. See “Who Should Swing Trade?”
The Exxon Mobil Corp. trade started with the breakout from an ascending triangle and ended using a stop. See “A Swinging Example.”
![]()
CHAPTER 2
Swinging Techniques
The key to swing trading is learning to identify when price is going to turn. If you can do that, then it is easier to profit from a move.
Figure 2.1 shows an example of how that key turning point works in action. In early November 2010, Boeing (BA) gapped down and made a straight-line run lower until it found support at 62. The speed of the decline and the support layer that it would slam into made me feel confident that the s...