
eBook - ePub
Measuring Biological Diversity
Anne E. Magurran
This is a test
Compartir libro
- English
- ePUB (apto para móviles)
- Disponible en iOS y Android
eBook - ePub
Measuring Biological Diversity
Anne E. Magurran
Detalles del libro
Vista previa del libro
Índice
Citas
Información del libro
This accessible and timely book provides a comprehensive overview of how to measure biodiversity. The book highlights new developments, including innovative approaches to measuring taxonomic distinctness and estimating species richness, and evaluates these alongside traditional methods such as species abundance distributions, and diversity and evenness statistics.
- Helps the reader quantify and interpret patterns of ecological diversity, focusing on the measurement and estimation of species richness and abundance.
- Explores the concept of ecological diversity, bringing new perspectives to a field beset by contradictory views and advice.
- Discussion spans issues such as the meaning of community in the context of ecological diversity, scales of diversity and distribution of diversity among taxa
- Highlights advances in measurement paying particular attention to new techniques such as species richness estimation, application of measures of diversity to conservation and environmental management and addressing sampling issues
- Includes worked examples of key methods in helping people to understand the techniques and use available computer packages more effectively
Preguntas frecuentes
¿Cómo cancelo mi suscripción?
¿Cómo descargo los libros?
Por el momento, todos nuestros libros ePub adaptables a dispositivos móviles se pueden descargar a través de la aplicación. La mayor parte de nuestros PDF también se puede descargar y ya estamos trabajando para que el resto también sea descargable. Obtén más información aquí.
¿En qué se diferencian los planes de precios?
Ambos planes te permiten acceder por completo a la biblioteca y a todas las funciones de Perlego. Las únicas diferencias son el precio y el período de suscripción: con el plan anual ahorrarás en torno a un 30 % en comparación con 12 meses de un plan mensual.
¿Qué es Perlego?
Somos un servicio de suscripción de libros de texto en línea que te permite acceder a toda una biblioteca en línea por menos de lo que cuesta un libro al mes. Con más de un millón de libros sobre más de 1000 categorías, ¡tenemos todo lo que necesitas! Obtén más información aquí.
¿Perlego ofrece la función de texto a voz?
Busca el símbolo de lectura en voz alta en tu próximo libro para ver si puedes escucharlo. La herramienta de lectura en voz alta lee el texto en voz alta por ti, resaltando el texto a medida que se lee. Puedes pausarla, acelerarla y ralentizarla. Obtén más información aquí.
¿Es Measuring Biological Diversity un PDF/ePUB en línea?
Sí, puedes acceder a Measuring Biological Diversity de Anne E. Magurran en formato PDF o ePUB, así como a otros libros populares de Biological Sciences y Zoology. Tenemos más de un millón de libros disponibles en nuestro catálogo para que explores.
Información
chapter one
Introduction: measurement of (biological) diversity1
I begin this book on a personal note. Most ecologists and taxonomists are based in Europe and North America (Golley 1984; Gaston & May 1992). I am no exception. Thus, like many others, my initial insights into the diversity and relative abundance of species were shaped by my experience of working in temperate landscapes. Indeed, the first iteration of this book grew out of my doctoral research on the diversity of Irish woodlands (Magurran 1988). We are all aware that species are distributed unevenly across the earth’s surface but the magnitude of the difference between the diversity of tropical and temperate systems is something that is difficult to comprehend from written accounts alone. Few places have illustrated this contrast more vividly for me than the Mamirauá Sustainable Development Reserve in the Brazilian Amazon2 (Bannerman 2001). The reserve, which is located at the confluence of the Solimões and Japurá Rivers near the town on Tefé in Amazonas, Brazil, covers 1,124,000ha (approximately one-third the size of Belgium) and is devoted to the conservation of võrzea habitat. Võrzea is lowland forest that experiences seasolinal flooding. In Mamirau;á forests can be flooded for more than 4 months a year, during which time water levels rise by up to 12 m. The challenge of producing an inventory of the animals and plants that inhabit this reserve is formidable. It covers a vast area, much of which is difficult to access. The expanse of water impedes sampling. Even fishing can be difficult at high water since the fish move out from the river channels to swim amongst the leaves and branches of the flooded trees.
Figure 1.1 A species accumulation curve for fish found in the floating meadow habitat at the Mamirauá Sustainable Development Reserve in the Brazilian Amazon. The number of species encountered is plotted against the area sampled. Data points reflect the order in which samples were taken. These data were kindly supplied by P. A. Henderson and the sampling methodologies are described in Henderson and Hamilton (1995) and Henderson and Crampton (1997).
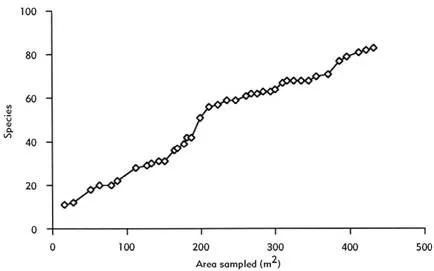
Not unexpectedly some groups of animals and plants in the reserve are much better recorded than others. As elsewhere it is the charismatic species, the birds and the mammals, that are most thoroughly enumerated. Mamirauá supports at least 45 species of mammals including two species of river dolphin (Inia geoffrensis and Sotalia fluviatilis), the Amazon manatee (Trichechus inuguis) and two endemic monkeys (the white uacari Cacajao calvus and the black-headed squirrel monkey Saimiri vanzolinii). In addition there are more than 600 species of vascular plants, approximately 400 species of birds and well over 300 species of fish. But even here there are gaps and omissions. Bats, for example, have not yet been formally surveyed. As Figure 1.1 reveals, the species accumulation curve for fish species associated with a single aquatic habitat— the floating meadow—shows no sign of reaching an asymptote, despite intensive sampling (Henderson & Hamilton 1995; Henderson & Crampton 1997). Estimates of the final total of fish species in the reserve remain extremely speculative. The invertebrate fauna is even less well documented and many new species undoubtedly await discovery and description. With the exception of a few key organisms, such as the pirarucu, Arapaima gigas, a bony-tongued fish now threatened as a result of over-exploitation (Queiroz 2000), abundance data exist for very few species. Visiting Mamirauá gave me a new perspective on the diversity of life on earth. It also provoked sobering reflections on the challenges of recording that diversity.
This is not to say, of course, that diversity measurement in other, less richly tapestried, habitats is problem free. I teach a course on biodiversity to third-year students in Scotland’s St Andrews University. One of the class assignments is to estimate the number of species in each of 40 taxa in the county of Fife. Data are presented as species presence in 5 × 5 km grid squares, standard estimation techniques are applied (these are described in Chapter 3) and the students are asked to present a report on the diversity of their chosen plant or animal group. Here too, it is the appealing taxa, the birds and the butterflies, that are most comprehensively recorded and for which the most robust estimates of richness can be obtained. Organisms that are difficult to identify or less popular with the public are much more patchily covered. The class invariably identifies a hotspot of mollusk diversity located in the grid square in which the Fife expert on the taxon happens to live and can hazard only a rough guess at the number of beetles and bugs that the county contains (see Chapter 3 for further discussion of these points). They find this uncertainty frustrating and recommend an increase in sampling effort. Yet, the data set holds more than 5,500 species and Fife is one of the most thoroughly surveyed counties in Britain, which in turn has one of the best species inventories in the world. It would clearly be desirable to fill all the gaps in the Fife data base, but the resources required to do this must be traded off against societal needs such as housing, education, and support for the disadvantaged. Taxpayers rarely find such arguments compelling.
These examples crystalize the challenges that biodiversity measurement must meet. Few surveys tally all species. Time, money, and experts with appropriate identification skills are invariably in short supply. Sampling is often patchy. In many cases it is even hard to judge the extent to which data sets are deficient. These problems are magnified as the scale of the investigation, the inaccessibility of habitat, and the richness and unfamiliarity of the biota increase. The practical difficulties of sampling are compounded when abundance data are collected. Yet, the need to produce accurate and rapid assessments of biodiversity has never been more pressing. It is against this backdrop that I have written this book. In the remainder of the chapter I reflect on changes in the field in the last 15 years (following Magurran 1988) and outline the book’s goals and limitations. I also set the scene by discussing my usage of the terms “biodiversity” and “biological diversity” and present some thoughts on how the nature of an investigation is molded by its geographic scale, as well as by the ecological arena in which it is conducted.
What has changed in the last 15 years?
Ecologists have always been intrigued by patterns of species abundance and diversity (Rosenzweig 1995; Hawkins 2001). Some questions raised by these patterns, such as the diversity of island assemblages, have proved amenable to study (MacArthur & Wilson 1967). Others, including latitudinal gradients of diversity, or the distribution of commonness and rarity in ecological communities, continue to challenge investigators (Brown 2001). The 1992 Rio Earth Summit marked a sea change in emphasis. Biological diversity was no longer the sole concern of ecologists and environmental activists. Instead, it became a matter of public preoccupation and political debate. Many people outside the scientific community are now conscious that biodiversity is being eroded at an accelerating rate even if few fully comprehend the magnitude of the loss. It has been estimated that around 50% of all species in a range of mammal, bird, and reptile groups will be lost in the next 300–400 years (Mace 1995). And while, on average, only a handful of species evolve each year (Sepkoski 1999 used the fossil record to estimate that the canonical speciation rate is three species per year) extinction rates may be as great as three species per hour (Wilson 1992, p. 268). No single catalogue of global biodiversity is yet available and estimates of the total number of species on earth vary by an order of magnitude (May 1990a, 1992, 1994b; and see Chapter 3). The Earth Summit also led national and local authorities to devise biodiversity action plans and to improve biodiversity monitoring. Probably the most significant change in the last 15 years therefore is the increased awareness of biodiversity issues. With this has come a broadening of the concept of (biological) diversity. This point is discussed in more depth below.
Heightened interest in biodiversity has led to the development of important new measurement techniques. Notable advances include innovative niche apportionment models (Chapter 2) along with improved methods of species richness estimation (Chapter 3) and new techniques for measuring taxonomic diversity (Chapter 4). Increased attention has also been devoted to sampling issues (Chapter 5) while methods of measuring β diversity (Chapter 6) have been refined. This is set against a deeper understanding of species abundance distributions and more empirical tests of traditional approaches. The fundamentals of biodiversity measurement may not have changed in the last 15 years but better tools are now available.
Heightened interest in biodiversity has led to the development of important new measurement techniques. Notable advances include innovative niche apportionment models (Chapter 2) along with improved methods of species richness estimation (Chapter 3) and new techniques for measuring taxonomic diversity (Chapter 4). Increased attention has also been devoted to sampling issues (Chapter 5) while methods of measuring β diversity (Chapter 6) have been refined. This is set against a deeper understanding of species abundance distributions and more empirical tests of traditional approaches. The fundamentals of biodiversity measurement may not have changed in the last 15 years but better tools are now available.
The third significant change in the last decade and a half is the near universal access to powerful computers and the advent of the internet. This technology has revolutionized the measurement of diversity. Greater computing power has also made the use of null models and randomization techniques more tractable. A growing list of computer pack-ages is now available and standard spreadsheets can be used to perform hitherto daunting calculations. Table 1.1 lists the computer packages mentioned elsewhere in the text. I have made no attempt to produce a comprehensive list but simply wish to draw the reader’s attention to the packages I have found useful. Some of these are freeware or shareware while others are commercially produced. Web site addresses are correct at the time of writing but there is no guarantee that they will still exist at the time of reading. I would be grateful to learn about other packages relating to methods outlined in the book.
Table 1.1 Biodiversity measurement software. A selection of web sites are listed that provide access to downloadable software or information on where this software can be obtained. The list is not exhaustive but does include those sites that have been used in the preparation of this book. All sites follow the normal convention of beginning http://. The table also indicates whether the software is written for a Macintosh or a PC (Windows) platform.
| Web sites | Software details |
| viceroy.eeb.uconn.edu/EstimateS | EstimateS package for species richness estimation. Also calculates a range of a diversity statistics and complementarity (b) measures. Mac and PC |
| homepages.together.net/~gentsmin/ ecosim.htm | Ecosim. Focuses on null models in ecology. Computes rarefaction curves and some diversity indices. PC |
| www.irchouse.demon.co.uk/ | Species Diversity and Richness. Calculates a range of diversity measures (with bootstrapping), richness estimators, rarefaction curves, and b diversity measures. PC |
| www.exetersoftware.com | Programs to accompany Krebs’s (1999) Ecological Methodology. Good range of richness, diversity, and evenness measures plus log normal and log series models. PC |
| www.biology.ualberta.ca/jbzustp/ krebswin.html | Provides software for some of the diversity measures (and other techniques) described in Krebs’s (1999) Ecological Methodology. PC |
| www.entu.cas.cz/png/PowerNiche/ | PowerNiche package provides expected values for certain niche apportionment models. PC |
| www.pml.ac.uk/primer/ | primer software. Multivariate techniques for community analysis. Includes diversity measures, dominance curves, and Clarke and Warwick’s taxonomic distinctness statistics (Chapter 4). PC |
Biodiversity, biological diversity, and ecological diversity
It is often assumed that the term “biological diversity” was coined in the early 1980s. Izsák and Papp (2000), for example, credit it to Lovejoy (1980a). Harper and Hawksworth (1995) note that the term is of older provenance but also date its renaissance to 1980 (Lovejoy 1980a, 1980b; Norse & McManus 1980). However, I first came across the concept in 1976 when discussing potential PhD topics with my supervisor, Palmer Newbould, so I can testify that the term biological diversity was already in current usage then (and that it had acquired much of its modern meaning). The earliest reference I can locate is by Gerbilskii and Petrunkevitch (1955, p. 86) who mention biological diversity in the context of intraspecific variation in behavior and life history. Undoubtedly there are even earlier examples. By the 1960s the term began to be used more widely. For example, Whiteside and Harmsworth (1967, p. 666) include it in a discussion of the species diversity of cladoceran communities while Sanders (1968, p. 244) suggests that diversity measurement, notably rarefaction, will help elucidate the factors that affect biological diversity. Harper and Hawksworth (1995) point out that Norse et al. (1986) were first to explicitly dissect biological diversity into three components: genetic diversity (within-species diversity), species diversity (number of species), and ecological diversity (diversity of communities).
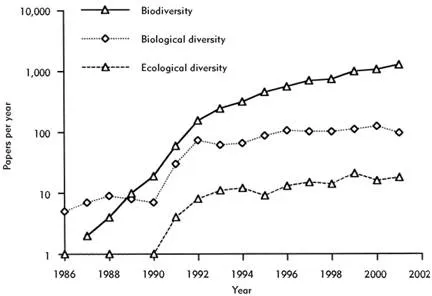
The word “biodiversity,” on the other hand, is indisputably of more recent origin. This contraction of “biological diversity” can be traced to a single event. It was apparently proposed in 1985 by Walter G. Rosen during the planning of the 1986 National Forum on BioDiversity (Harper & Hawksworth 1995). The subsequent publication of these proceedings in a book entitled Biodiversity, under the editorship of E. O. Wilson (1988), introduced the term to a wider audience. In fact the word caught the mood of the moment so well that it soon overtook biological diversity in popularity (Figure 1.2). Like most other users (see also Harper & Hawksworth 1995), I use “biodiversity” and “biological diversity” interchangeably. The United Nations Environment Programme (UNEP) definition (Heywood 1995, p. 8) is widely cited:
“Biological diversity” means the variability among living organisms from all sources including, inter alia, terrestrial, marine and other aquatic systems and the ecological complexes of which they are part; this includes diversity within species, between species and of ecosystems.
Harper and Hawksworth (1995) take exception to the reference to ecosystem, an entity that includes the physical environment (which by definition does not have biodiversity). They suggest “community” as a substitute. While it does not matter greatly whether “biodiversity” or “biological diversity” is the chosen term, the fact that the concept spans a range of organizational levels means that it is important to specify how it is being used. Harper and Hawksworth (1995) propose the adjectives “genetic,” “organismal,” and “ecological” to match the three levels embodied in the UNEP definition.
Figure 1.2 The number of papers per annum (between 1986 and 2001) that mention “biodiversity,” “biological diversity,” or “ecological diversity” in their titles, abstracts, or keywords. Note log scale on y axis. (Data from Web of Science (http://wos.mimas.ac.uk/).)
Hubbell (2001, p. 3) offers a more focused definition that is closer to the subject matter of this book. He defines biodiversity to be “synonymous with species richness and relative species abundance in space and time.”
There is an important distinction between the concept of biodiversity and the notion of a “biodiversity movement.” The biodiversity movement is concerned with political and ethical issues as well as biological ones. Issues such as pesticide use, environmental economics, the fate of endangered species and land use fall within its domain. Indeed, as Smith (2000, p. x) has pointed out “it has more to do with human aspirations than it does with biological focus.” I do not consider the biodiversity movement further except to observe that the discussions and decisions it entails must be underpinned by accurate biodiversity assessment.
“Ecological diversity” is a term that has come to have several overlapping meanings. Pielou (1975, p. v) defined it as “the richness and variety… of natural ecological communities.” In essence, in its original formulation ecological diversity was something that could be measured by a diversity index. It was for that reason that I used it in the title of my first book (Magurran 1988). Norse and McManus (1980) treated ecological diversity as equivalent to species richness—a more restrictive definition than Pielou’s. At present, where it is used at all, ecological diversity is synonymous with biological diversity in its broadest sense (Harper & Hawksworth 1995). It is now associated with the diversity of communities (or ecosystems) and covers matters such as the number of trophic levels, the range of life cycles, and the diversity of biological resources as well as the variety and abundance of species. This evolving terminology is one reason for reverting to the most enduring term of all, “biological diversity,” for the title of this book. The fact that “ecological diversity” is little used these days is another (Figure 1.2).
The definition of biological diversity I have adopted for the book is simply “the variety and abundance of species in a defined unit of study.” My goal is to evaluate the methods used to describe this diversity. I focus on species because they are the common currency of diversity. The first question that people ask is usually something like “how many species of trees are found in Costa Rica?” or “how many beetles are there in England’s New Forest?” or even “how many species are there on the earth?” This focus does not preclude measures that involve phylogentic information, which must in any case be weighted by species richness. I include abundance because the relative importance of species is a significant topic in its own right, and also because relative abundance is implicitly, if not explicitly, involved in the estimation of species richness.
Izsák and Papp (2000) make a distinction between measures of ecological diversity and measures of biodiversity. Measures of ecological diversity traditionally, but not invariably (see, for example, Pielou 1975; Magurran 1988), take account of the relative abundance of species. A familiar example is the Shannon index, discussed in depth in Chapter 4. This class of measures treats all species as equal (see the section below on the assumptions of biodiversity measurement). Newer measures typically ignore abundance differences between species, focusing instead on taxonomic differences. However, I find Izsák and Papp’s (2000) distinction artificial, not least because Pielou (1975), in her pioneering text on ecological diversity, considered ways of incorporating phylogenetic information into diversity measures. It is also of note that Warwick and Clarke’s (2001) taxonomic distinctness measure—one of the most promising new approaches—is a form of the Simpson index, and can be a...