![]()
CHAPTER 1
Making Order Out of Short-Term Chaos
There are two primary ways we make money trading: catching a big price move with a small position or having a large position and catching a small move.
—Bill Meehan
If what I have written so far has meshed with your speculative goals, it is time to learn how markets operate. Speculation—stock and commodity trading—is not for everybody; it may not be for you. I have even wondered at times if it is for me!
It's striking how little has changed in this chapter. The concepts presented here are the same now as 10 years ago, or 20, or 100. This is the foundation for my trading. My view is that there is definite market structure and a map or way that price moves from one point to another. Once you identify that, it will hold just as true in the pit session markets as it will in the electronic session markets. There is a language to how prices move that is based on an alphabet of each day's opening, high, low, and closing price. It has been my mission to decode these hieroglyphics so we can all “read” the markets better. I am still at that task, like some archeologist hunched over the Sumerian Records, seeking truth.
The curve ball we have been thrown since the first edition of this book is this: Thanks to computers, trading pits have given way to electronic trading. These new electronic markets now open somewhere in the world just a few hours after they closed. The influence of pit trading in open outcry markets has vanished.
HOW I LEARNED ABOUT THE MARKET
My career as a trader began in Portland, Oregon, where I had met a Merrill Lynch broker who thought we could make some money together. He was half right: We got lucky immediately. He made good money on his commissions and I lost money. Worse yet, the money wasn't mine; a fellow I had never met had asked me to invest it. In hindsight, the initial beating I took was more than fortunate, it was life changing.
That event hardened my desire to learn the business; after all, if it was that easy to lose, it had to be pretty easy to win, right? My broker was as new to the game as I was and really had very little advice or suggestions. His market insight was to buy good stocks and hold on to them (a brilliant insight), but my aptitude or desire was to make money from catching short-term market swings. Thus began my education as a short-term trader.
I had no teacher and knew no other traders, so I naturally turned to books to help solve my problems, just as you have in buying this book. The authors all made it sound so easy. I read Joe Granville's classic work on technical analysis and began keeping track of daily open, high, low, and closing prices on stocks as well as other indicators that Joe said we should follow. Joe, a true legend, is still worth reading. Before I knew it, I was not only totally consumed by the markets but spending five to six hours a night and all my weekends trying to beat Wall Street, in the meantime gaining a fortune and beginning to lose a marriage.
My first wife, Alice Fetridge, had become a “chartist's widow” yet still supported my habit. We eventually left Portland and moved to Monterey, California. We both had jobs, and I was also working on my law degree. I even sat for and passed the “Baby Bar Exam” (the test given to night school and correspondence students). By then, however, I had pretty much given up on becoming a lawyer, especially after working for one. I had thought being a lawyer meant being in court, saving people's lives; the reality was that it mainly meant collecting money from judgments, finding deadbeats, and representing bums and outright criminals. It was not like trading.
Fortunately in Monterey, I met two brokers who, like me, kept charts. Joe Miller and Don Southard were soon swapping war stories with me, teaching what they knew about the markets. We were all big followers of Joseph Granville's on-balance volume (OBV) work and kept OBV charts on the 30 to 50 stocks we followed. I also started to keep moving averages, another tool espoused in all the books back then, just as they are today.
My stock trading met with some success, but what accelerated my career was a book by Gil Haller, unabashedly called The Haller Theory of Stock Market Trends (Gilbert Haller, 1965). I learned a lot about stocks and speculation from the book, then got to know Gil and to this day appreciate the support and encouragement he provided. Gil's concept—we are talking 1963—was to buy stocks that had already moved up a lot. This is now a methodology used by the funds to buy what they call “momentum stocks.” Haller was doing it way back in 1964 and making a living. But, he didn't live the way I wanted to! His desk was an old door atop cinder blocks, stationery was the back of a letter someone had written to him. Gil was not cheap, just a frugal spender who precisely counted and saved every extra penny.
Eventually, I began to envision a theory of how markets work: In the short term, markets spurt in rallies and declines, moving above and below a balance point I could call the “average” price. My object was to determine when price was low and should move back to the average. That meant I needed to identify an overextension of price and then have something that would tell me when this move was over and the spring back to the average had begun. Because it all seemed so easy, I was sure there must be some master theory or code to how all this was done. There must be some basic undeniable way the market—all markets—moved from point A to point B, I reasoned.
What I eventually found out is that this original thesis is true: There is a way markets move. The good news is that there is a structure in how prices move from point A to point B. The bad news is that the structure is imprecise. Nevertheless, there is a semblance of order to price action, and, like a foreign language, it can be learned. It has taken most of my life to figure out the basics of this language that the market speaks, and I am more than happy to help you learn to use my magic decoding ring.
CHARTING THE MARKET
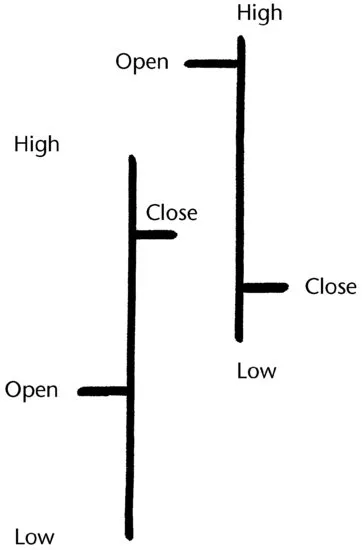
If you have begun your study of the markets, you already know it is a visual world, where charts prevail. As shown in Figure 1.1, the common charts represent each day's opening price with a horizontal slash mark to the left side of each bar and the closing price with a horizontal slash on the right side of the bar. The topmost point of the bar reflects the highest price reached by the stock or commodity during the day while the bottom of the bar represents just the opposite, the lowest price the commodity traded at on that day.
The opening price, as you will see later on, is the most important price of the day. I developed this notion with Joe Miller, Don Southard, and Curt Hooper, a naval postgraduate student who—in 1966—was the first person I ever worked with while using a computer to arrive at answers. While we were impressed with OBV, we wanted a more reliable formula, and once we learned that the original OBV work came from two guys from San Francisco, Woods and Vignolia, we thought that we, too, could create a better approach.
Our chart-reading problem begins and leads to chaos when we start combining these daily bars of price action on a chart. These graphic representations of price action were “read” for years by folks calling themselves “chartists.” By and large, chartists were about as welcome as your unemployed brother-in-law until the early 1980s.
This crowd gleaned over chart formations, found patterns, and gave them names like wedges, head and shoulders, pennants, flags, triangles, W bottoms and M tops, and 1-2-3 formations. These patterns were supposed to represent the battle of supply and demand. Some patterns indicated selling, others professional accumulation. Fascinating stuff, but wrong-headed. These same precise patterns can be found in charts of things that do not have a supply/demand factor.
Figure 1.2 shows a chart of the 150 flips of an old silver dollar that graphs out to look much like a chart of Pork Bellies. Next, Figure 1.3 is a chart or graph of temperature extremes, or is it Soybeans? Who knows? What we do know is that plotted data of nonmarket or economically driven information charts out just like...