Part I
Describing Data
In this part . . .
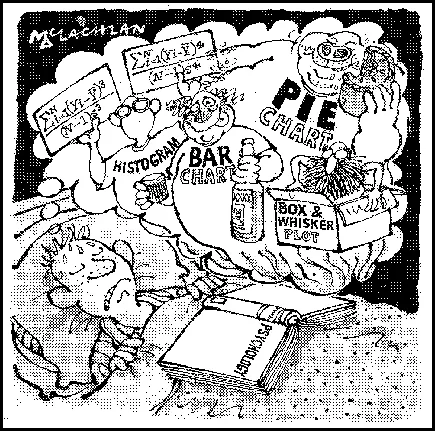
We know: you’re studying psychology, not statistics. You’re not a mathematician and never wanted to be. Never fear, help is near. This part of the book covers the key concepts you need to grasp to describe statistical data accurately and successfully. We talk about the simplest descriptive statistics – mean, mode and median – and important ideas such as measures of dispersion and how to interpret and produce the graphs for displaying data.
We also introduce you to SPSS (Statistical Package for Social Sciences, to give it its full name) and walk you through the basics of using the program to produce straightforward statistics.
Chapter 1
Statistics? I Thought This Was Psychology!
In This Chapter
Outlining descriptive and inferential statistics
Differentiating between parametric and non-parametric statistics
Explaining research designs
When we tell our initially fresh-faced and enthusiastic first year students that statistics is a substantial component of their course approximately half of them are genuinely shocked. ‘We came to study psychology, not statistics’, they shout. Presumably they thought they would be spending the next three years ordering troubled individuals to ‘lie down on the couch and tell me about your mother’. We tell them there is no point running for the exits as they will quickly learn that statistics is part of all undergraduate psychology courses, and that if they plan to undertake post-graduate studies or work in this area they will be using these techniques for a long time to come (besides, we were expecting this reaction and have locked the exits). Then we hear the cry ‘But I’m not a mathematician. I am interested in people and behaviour’. We don’t expect students to be mathematicians. If you have a quick scan through this book you won’t be confronted with pages of scary looking equations. These days we use computer-based software packages such as SPSS to do all the complex calculations for us. We tell them that psychology is a scientific discipline. If they want to learn about people they have to objectively collect information, summarise it and analyse it. Summarising and analysing allows you to interpret the information and give it meaning in terms of theories and real world problems. Summarising and analysing information is statistics; it is a fundamental and integrated component of psychology.
The aim of this chapter is to give you a roadmap of the main statistical concepts you will encounter during your undergraduate psychology studies and to signpost you to relevant chapters on topics where you can learn how to become a statistics superhero (or at least scrape by).
Know Your Variables
All quantitative research in psychology involves collecting information (called data) that can be represented by numbers. For example, levels of depression can be represented by depression scores obtained from a questionnaire, or a person’s gender can be represented by a number (1 for male and 2 for female). The characteristics you are measuring are known as variables because they vary! They can vary over time within the same person (depression scores can vary over a person’s life time) or vary between different individuals (individuals can be classified as male or female, but once a person is classified this variable doesn’t tend to change!).
Several names and properties exist, associated with variables in any data set, which you must become familiar with. Variables can be continuous or discrete, have different levels of measurement and can be independent or dependent. We cover all this information in Chapter 2. Initially these terms may seem a little bamboozling, but it is important you ensure you have a good understanding of them, as they dictate the statistical analyses that are available and appropriate for your data. For example, it helps to report a mean depression score of 32.4 for a particular group of participants, but a mean gender score of 1.6 for the same group doesn’t much make sense (we discuss the mean in Chapter 4)!
Variables can be classified as discrete, where you specify discrete categories (for example, male and female), or continuous, where scores can lie anywhere along a continuum (for example, depression scores may lie anywhere between 0 and 63 if measured by the Beck Depression Inventory).
Variables also differ in their measurement properties. Four levels of measurement exist:
Nominal: This contains the least amount of information of the levels. At the nominal level, a numerical value is applied arbitrarily. Gender is an example of
nominal level of measurement (for example, 1 for male and 2 for female), and it makes no sense to say one is greater or less than the other.
Ordinal: Rankings on a class test are an example of an
ordinal level of measurement; we can order participants from the highest to the lowest score but we don’t how much better the first person did compared to the second person (it could be 1 mark or it could be 20 marks!).
Interval: IQ scores are measured at the
interval level, which means we can order the scores but the difference between each point is equal. That is, the difference between 95 and 100 is the same as the difference between 115 and 120.
Ratio: In a ratio level of measurement, the scores can be ordered, the difference between each point on the scale is equal and the scale also has a true absolute zero. Weight, for example, is measured at the
ratio level; having a true zero means a weight of zero signifies an absence of any weight and it also allows you to make proportional statements, such as ‘10 kg is half the weight of 20 kg’.
You will also need to classify the variables in your data as independent or dependent and the classification will depend on the research question you are asking. For example, if you are investigating the difference in depression scores between males and females, the independent variable is gender (this is the variable you think that is predicting a change), and depression scores are the dependent variable (this is the outcome variable where the scores depend on the independent variable).
What is SPSS?
The initials SPSS stand for Statistical Package for the Social Sciences and it provides you with a program capable of storing, manipulating and analysing your data. This book assumes you will be using SPSS to analyse your data. SPSS is probably the most commonly used statistics package in the social sciences, but of ...