![]()
1
Graphic Optimization
The purpose of this chapter is to show examples of reasoning for abstraction-deduction-interpretation for simple management problems of two variables. Just as shown in Figure 0.4 in the Preface, the first stage of abstraction corresponds to the verbal description of the problem. This description is reduced to algebra (which in Arabic means “reduction”), which relates numbers and symbols in equations and formulas.
Next, we study the decision problem through analytical geometry, which translates algebraic formulas into geometrical figures. The translation is done using a reference system of coordinate axes perpendicular to each other called “Cartesians,” in honor of René Descartes (1596–1650). Being problems of two variables, the objective function and the constraints can be represented as flat figures. This can be solved using flat Euclidean geometry, i.e., drawing points, lines and other elements on a plane.
We present the theory of graphic optimization through a number of applications in management. In Section 1.1 we present how linear programming can assist strategic planning, which consists of making critical decisions regarding the direction of the organization and the allocation of essential resources. In Section 1.2 we review management control systems, which gather key performance indicators of different areas to assess the realization of the strategy. In Section 1.3 we review one of the canonical problems in logistics: to define the configuration of the fleet. Section 1.4 introduces process management as a way to model and optimize the activities performed by the firm. Finally, in Section 1.5 we discuss why a proper definition of the objective function and the constraints is so relevant for making the best decisions for the organization.
1.1 Strategic Planning
Winston Churchill said, “Plans are of little importance, but planning is essential.” In other words, it is not necessarily the result of planning that matters but rather the systematic reflection that prepares for action and reaction to contingencies. Strategic planning chooses the competitive strategy for the company. According to Stoelhorst and van Raaij (2004), it can be understood in the context of different theories. One of the most relevant is the neoclassical theory of the firm, which predicts that markets are prone to hyper-competition, in which the most effective strategy is to maximize the efficiency of the firm. This means generating the maximum economic value using the least amount of resources.
One of the economic activities that best fits this description is the fruit industry. Grapes, apples and oranges produced in Chile, Spain or the USA compete as equals to reach consumers in China, India and Europe. As such, the countries must strengthen their productivity, i.e., their ability to produce more fruit with fewer workers, cultivated land, capital goods and agricultural inputs (Guzmán & Singer, 2009). This productivity depends on, among other factors, the production decisions of the companies, illustrated in the following example.
1.1.1 Fruit Company Case
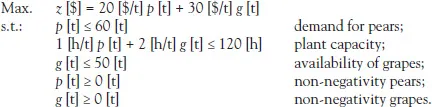
Suppose that a fruit packing plant must determine the quantity of pears and grapes to be processed in order to maximize its income1 (Lowe & Preckel, 2004). As the decisions of pears and grapes are independent, we will say that there are two degrees of freedom in this problem. However, a set of constraints must be met. The maximum grape availability is 50 tons [t] during the harvest season. The capacity of the plant is 120 hours [h]. Each ton of pears requires 1 [h] of plant resource, while each ton of grapes requires 2 [h]. Given the demand it faces, it can sell a maximum of 60 [t] of pears. Pears are sold at $200 US per ton [$/t] and the grapes are sold at 300 [$/t].
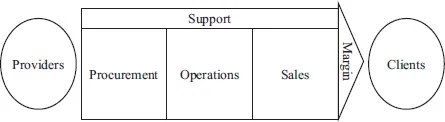
To translate this problem into the language of mathematics, we first identify the variables and parameters. The variables are: income z (measured in dollars [$]),2 quantity of pears p (expressed in [t]) and grapes g to be processed (expressed in [t]).3 The parameters are, among others, the price of the pears Pp = 200 [$/t] and the price of the grapes Pg = 300 [$/t].4 With the decision variables and the parameters, we define the objective function as the maximization of z [$] = Pp [$/t] p [t] + Pg [$/t] g [t]. The set of feasible decisions is defined by the constraints of grape availability, production capacity and pear demand, in addition to the non-negativity constraints of pears and grapes. These limitations correspond to Porter (1985) value chain in Figure 1.1, whereby the firm adds value from suppliers to clients, constrained by the capacity of each of its functional units: Procurement, Operations and Sales.
Figure 1.1 Value Chain (of Porter) of the Fruit Packing Plant
This is summarized in the following maximization, subject to (s.t.) a system of inequalities.
Exercise 1: Non-negativity constraints
Any negative value of p or g reduces the objective function that is being sought to maximize. For example, if p = −1, 300 [$] of income is lost. So, is it necessary to make explicit non-negativity constraints, or will these be met automatically?
Answer: If g = −1, 2 [h] of plant resource are “freed,” which allows producing 2 [t] more of pears and thereby earning 2 · 200 [$] = 400 [$]. Since there are no negative pears, in principle, g should be prevented from taking a value less than zero. However, the production of pears is restricted by p ≤ 60 [t], so making g negative does not produce benefits. Therefore, non-negativity constraints will be met automatically.
The use of plant capacity for processed grapes corresponds to its unit cost. In this case, it is 2 [h/t]: to produce 1 [t] of grapes, it consumes 2 [h] of plant resource. The inverse of the unit cost of the grape is the productivity of the packing plant in terms of grapes: (2 [h/t])−1 = (1/2 [t/h]). The productivity is the amount of tons of grapes that can be produced in one hour. Therefor...