
Making Sense of Lung Function Tests
Jonathan Dakin, Mark Mottershaw, Elena Kourteli
- 204 páginas
- English
- ePUB (apto para móviles)
- Disponible en iOS y Android
Making Sense of Lung Function Tests
Jonathan Dakin, Mark Mottershaw, Elena Kourteli
Información del libro
Respiratory problems are the most common cause of acute admission to hospital. A variety of diagnostic investigations are required, both for acute and clinic assessment. Making Sense of Lung Function Tests, Second Edition familiarises both trainees and more experienced clinicians with the interpretation of a range of respiratory parameters. It places lung function in a clinical context using real-life examples and provides invaluable hands-on guidance.
For this second edition Consultant Respiratory Physician Jonathan Dakin and Consultant Anaesthetist Elena Kourteli are joined by Mark Mottershaw, Chief Respiratory Physiologist from Queen Alexandra Hospital, Portsmouth, all contributing a broad range of expertise and perspectives. Together they have updated the book throughout and added new chapters including an algorithm for interpretation of pulmonary function tests, exhaled nitric oxide (FENO) and cardiopulmonary exercise testing.
The text offers a clear explanation of the concepts which students find difficult, including:
-
- The basis of obstructive and restrictive defects
-
- Pattern recognition of the flow volume loop
-
- Differences between TLCO and KCO
-
- Assessment of oxygenation using PO2 and SO2
-
- The basis of Type 1 and type 2 respiratory failure
-
- Distinguishing respiratory and metabolic acidosis
-
- The relationship between sleep and respiratory failure
The information is presented in an accessible way, suitable for those seeking a basic grounding in spirometry or blood gases, but also sufficiently comprehensive for readers completing specialist training in general or respiratory medicine.
Preguntas frecuentes
Información
1
Expressions of normality
| Degree of severity | FEV1% predicted |
| Normal | >80 |
| Mild | 70–79 |
| Moderate | 60–69 |
| Moderately severe | 50–59 |
| Severe | 35–49 |
| Very severe | <35 |
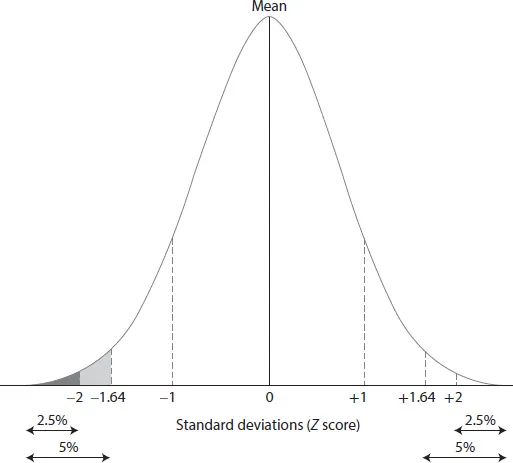
| Standard residual | Grade of severity |
| –1.64 or greater | Normal |
| –1.65 to –2.50 | Mild |
| –2.50 to –3.50 | Moderate |
| <–3.50 | Severe |
- The percentage of predicted is the most commonly used expression of normality, which is simple to calculate and intuitively understood. However, the cut-off for normality (e.g. <80%) is chosen arbitrarily and may result in under- or overdiagnosis of pathology.
- The use of standard residuals is more robust and provides a statistically valid method to identify values that fall below the limits of normal physiological variability. Usage of standard residuals is increasing and may ultimately replace the percentage predicted.