
eBook - ePub
U.S. Household Consumption, Income, and Demographic Changes
1975-2025
Philip Musgrove
This is a test
Compartir libro
- 252 páginas
- English
- ePUB (apto para móviles)
- Disponible en iOS y Android
eBook - ePub
U.S. Household Consumption, Income, and Demographic Changes
1975-2025
Philip Musgrove
Detalles del libro
Vista previa del libro
Índice
Citas
Información del libro
The impacts of the two variables of population and income growth on resources and the environment are transmitted through their effects on the demands for goods and services. To enrich our understanding of the impacts of population and income on consumer demand, Philip Musgrove, with the assistance of Adele Shapanka, undertook the research in this volume, which was first published in 1982. This book will be of interest to students of economics and environmental studies.
Preguntas frecuentes
¿Cómo cancelo mi suscripción?
¿Cómo descargo los libros?
Por el momento, todos nuestros libros ePub adaptables a dispositivos móviles se pueden descargar a través de la aplicación. La mayor parte de nuestros PDF también se puede descargar y ya estamos trabajando para que el resto también sea descargable. Obtén más información aquí.
¿En qué se diferencian los planes de precios?
Ambos planes te permiten acceder por completo a la biblioteca y a todas las funciones de Perlego. Las únicas diferencias son el precio y el período de suscripción: con el plan anual ahorrarás en torno a un 30 % en comparación con 12 meses de un plan mensual.
¿Qué es Perlego?
Somos un servicio de suscripción de libros de texto en línea que te permite acceder a toda una biblioteca en línea por menos de lo que cuesta un libro al mes. Con más de un millón de libros sobre más de 1000 categorías, ¡tenemos todo lo que necesitas! Obtén más información aquí.
¿Perlego ofrece la función de texto a voz?
Busca el símbolo de lectura en voz alta en tu próximo libro para ver si puedes escucharlo. La herramienta de lectura en voz alta lee el texto en voz alta por ti, resaltando el texto a medida que se lee. Puedes pausarla, acelerarla y ralentizarla. Obtén más información aquí.
¿Es U.S. Household Consumption, Income, and Demographic Changes un PDF/ePUB en línea?
Sí, puedes acceder a U.S. Household Consumption, Income, and Demographic Changes de Philip Musgrove en formato PDF o ePUB, así como a otros libros populares de Biological Sciences y Ecology. Tenemos más de un millón de libros disponibles en nuestro catálogo para que explores.
Información
Chapter 1
INTRODUCTION AND SUMMARY
The fundamental question addressed by this study is, how might different courses of population growth over the next half century affect the level and structure of final demand in the United States economy? The bulk of final demand is for personal consumption, that is, expenditures made directly by households for their own use. A priori, any element of this expenditure may be sensitive to demographic growth, since different kinds of households may have different spending patterns. Public consumption, which constitutes the rest of consumption demand, includes some elements which may be expected to be very demographically sensitive, such as education, and others which probably do not vary with the composition of the population and may even be fairly insensitive to its size, such as defense. Most of investment, the third major component of domestic product, is a derived demand, undertaken in response to household or public demands for goods and services, but it includes one component—housing construction—which is bought directly by households and may be expected to vary significantly with demographic factors. Two other components of construction—for schools and for hospitals—are derived directly from current and projected expenditures on education and on health care, respectively, and so may also be demographically sensitive.
Since our emphasis is on demographic effects on demand, we are concerned with the demands for goods and services consumed by individuals (whether or not they buy the goods and services), and not with the consumption of indivisible public goods. Nearly all of private consumption in this sense is accounted for by personal consumption expenditure; the remainder consists of publicly provided education and health care. These last two components are traditionally classified as government expenditures, but we include them in our enlarged definition of consumption. The construction components of interest—housing, schools and hospitals—also mix public and private investments.
In this study, we examine the consequences of population alternatives on private consumption and these three types of construction only, without deriving from them the level and composition of other types of investment (buildings, machinery and transportation infrastructure) that would be required. We also do not attempt to study saving, international trade, or the effects of different demands on resource use or the emission of wastes. We also limit the analysis to comparisons among scenarios, or hypothetical futures, which differ significantly only in the assumptions made about population and income growth. All other factors affecting future demand—tastes, prices, and technical progress—are assumed the same in all scenarios, so that while they are extremely important, they contribute little or nothing to differences between one possible future and another. In particular, we assume that prices are independent of demand levels, so that supply constraints are not considered. This is unquestionably the most serious limitation of the study: it means that we are trying to isolate certain effects of interest rather than project what the future will actually be.
Background to This Study
The general question of how population growth, and particularly changes in growth, affects final demand, has been investigated in a number of papers, many of which consider questions excluded from our analysis, such as investment and saving. Serow and Espenshade (1977) review this literature, and Espenshade (1977) has estimated demand functions for eleven expenditure categories, taking account of the population age distribution (in three size classes) and the average household size. No household-level data were used.
The present analysis builds on the INFORUM model of the U.S. economy developed by Almon and associates (1974). That model divides personal consumption expenditures into 133 sectors related through an input-output table; public or governmental consumption comprises another fourteen sectors. Demand equations were originally fitted for each sector using aggregate time-series data, expenditure in a sector depending on total population, per capita disposable income and (for many sectors) a time trend to capture technological or taste changes. Disaggregated data entered into these estimates and projections in only two ways: first, income elasticities for some sectors were estimated from the 1960–61 Consumer Expenditure Survey of households; and second, demand in some sectors (particularly education) depended on population in specific age groups rather than on total population. This approach can in principle capture the effects of population scale and income on demand, but—with the exceptions noted—cannot say anything about compositional effects. Even when the age composition of the population is taken into account, no assumptions are made about the distribution of people, or of income, among households. To the extent that composition and distribution matter, this aggregate approach must erroneously attribute their effects either to scale or to per capita income changes, and it may wrongly estimate the total effect. In an extension of this work, Herzog (n.d.) used disaggregated data from the 1960–61 Consumer Expenditure Survey to make the income coefficients of the sectoral equations “demographic specific.” The basic equation is still estimated from time-series data in this approach, but the income effect itself is related to population composition.
The INFORUM model was extended in a different way by Ridker and Watson (1980), who re-estimated a number of the sectoral demand equations or modified them by changing the assumptions about time trends. The revised set of demand functions was combined with three alternative projections of population growth, from Census Bureau series D, E and F, and with alternative assumptions concerning average labor productivity. Whereas Almon’s group initially made projections only to the year 1985, Ridker and Watson carried their projections out to 2025, extending the Census Bureau’s projections where necessary. The model was then applied to estimate the resource-use and environmental impacts of the three projected population scenarios. The underlying demand relations, although sometimes modified to take account of changes in prices, technology, tastes or other factors, are still based on aggregate, time-series data on consumption and income. These demand functions do not appear, sector by sector, in Ridker and Watson’s published study; we include the detailed results, for some sectors, here for the first time.
In 1972–73 the Census Bureau and the Bureau of Labor Statistics repeated a Consumer Expenditure Survey, providing detailed data on household spending patterns throughout the United States for the first time in more than a decade. These data make it possible to estimate demand in the sectors bought by households, at the level of individual households or spending units, taking account of their composition and of the distribution of income among them. The object of the present study, then, is to re-estimate the demand equations using these data with the greatest disaggregation possible, and to use them to project demand as a function of the projected structures of income and population. We continue to use the sectoral disaggregation employed by Ridker and Watson, which is shown in table 1-1. We also use their assumptions concerning population growth, and we assume alternatively that labor productivity does not grow at all (an assumption not considered by Ridker and Watson) or that it grows at a constant rate of just under two percent per year. Since our emphasis is on population rather than income effects, it did not seem worthwhile to experiment with other assumptions about income growth, and in particular with a more rapid growth of productivity. The assumptions of Ridker and Watson, together with our no-growth assumption, lead to a set of six projections (Census Bureau population series D, E and F, each with and without productivity growth, over the period 1975–2025). This framework is retained despite the fact that the Census Bureau has since revised downward slightly its population projections (new series I, II and III), for two reasons. One is that we are saved the trouble of creating new income projections to match the new population projections, which does not seem justified in view of the very small changes in the latter. The other is that we can compare our results directly with those obtained by Ridker and Watson, and thus see how much difference it makes to introduce demographic and distributional detail into the analysis. This provides a way to evaluate the implicit assumption made in all aggregative models, which is that distribution, either of people or of income, does not matter.
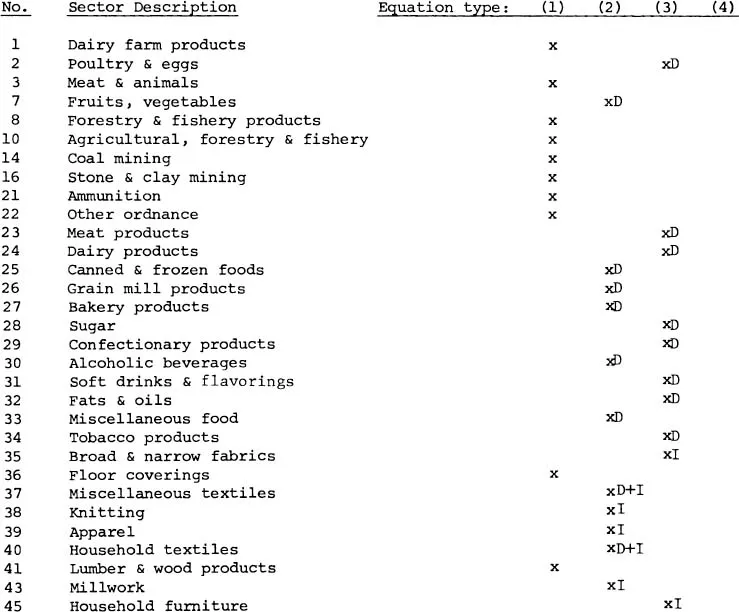
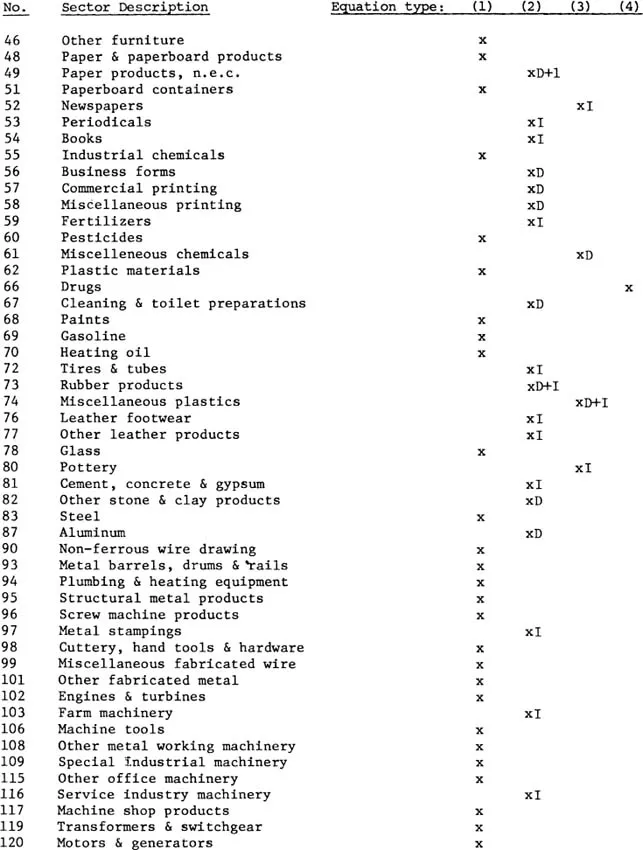
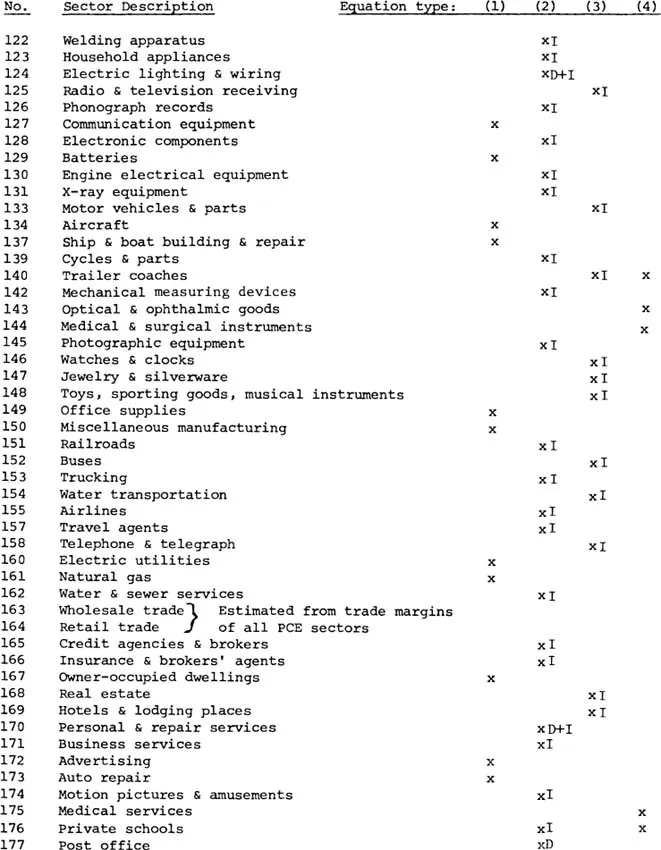
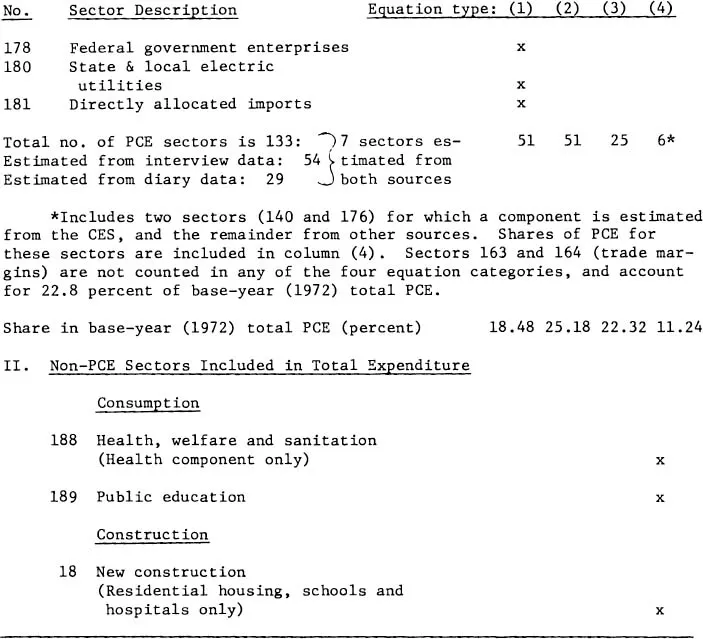
Table 1-1. Summary of Type of Equation Used for Sector Projections
Four types of projecting equations are distinguished:
(1) Time-series equation retained (from Ridker and Watson), not sensitive to population composition
(2) Household equation estimated from the CES, without subsequent adjustment
(3) Household CES equation, with adjustment overall or to individual coefficients. For types (2) and (3), D means the CES Diary data were used, and I indicates the use of the interview data
(4) New cross-section or time-series equation estimated from other sources than the CES (chiefly time-series data), sensitive to population composition
I. Personal Consumption Expenditure (PCE) Sectors
In basing our analysis so far as possible on individual households, we are, of course, trading one set of problems for another, buying detail at the cost of possible biases and gaps. One immediate problem is that households do not account for all of spending on personal consumption, and, of course, they do not account for the rest of final demand. A hybrid analysis is necessary, in which some sectors will have to be estimated and projected from aggregate data, either because households do not buy for their own consumption or because the household information is inadequate. Some of these estimates are taken from Ridker and Watson, and some are newly estimated from other sources. A second difficulty is that cross-section estimates may be biased because they do not incorporate time trends, representing as they do only one point in time, and the data even at that point may contain transitory or atypical components of spending. Some link to aggregate estimates is therefore necessary to ensure overall consistency. Finally, if the structures of population and income determine the demand structure in the future, they must themselves be projected, which is more difficult than projecting total population and income. Assumptions must be made about behavior not only at the level of spending but also at the level of household formation and the inter-household distribution of income, and such assumptions leave much room for error or doubt. Nonetheless, these assumptions are of interest in their own right, and offer a way to see just how different population scenarios might differ in detail. The rate of population growth cannot change without also changing the age structure of the population, its distribution into households, and the level and distribution of income. It seems better to try to model these indirect consequences and to see their effects on final demand than to suppress them, especially since aggregate (non-distributional) projections are available to which to compare the results.
Organization of This Volume
As described earlier, the 1972–73 Consumer Expenditure Survey (CES) provides the data from which demand is projected for the majority of consumption sectors. Since the projections are in constant 1971 producer prices, while the data refer to consumer prices over a two-year period, a great deal of adjustment is necessary before estimating demand functions. A further complication arises because the CES is actually two independent samples, one set of data referring to food and other frequent expenditures with a weekly period of reference and the other to less frequent non-food spending with an annual reference period. These two sources are linked in the estimating equations via total food expenditures at home and away from home, since these totals are reported in both surveys.
Chapter 2 describes the preparation of the CES data and the choice of functional form for the demand equation, with the exact specification of the four independent variables used: income, household size, household composition and age of head. This chapter also describes how we projected the distributions of household size, composition and income. Since the estimation of the demand equations is itself a large task whose results may be of interest quite apart from their use for projection, the coefficients and standard errors of the equations are available on request. Chapter 2 summarizes the sizes and statistical significance of all the income and demographic effects, even for those equations which were subsequently modified for projection or replaced altogether. The reader interested only in the projection results may omit the latter parts of this chapter and proceed to chapter 6.
Several major spending categories which lie wholly or partly outside of personal cons...