EEG Technology
eBook - ePub

EEG Technology

R. Cooper, J. W. Osselton, J. C. Shaw

Compartir libro
  1. 288 páginas
  2. English
  3. ePUB (apto para móviles)
  4. Disponible en iOS y Android
eBook - ePub

EEG Technology

R. Cooper, J. W. Osselton, J. C. Shaw

Detalles del libro
Vista previa del libro
Índice
Citas

Información del libro

EEG Technology provides information and advice related to electroencephalography (EEG). The objective and purpose of this book is to learn more about people given that a person's brain is the person, in sickness or in health. This book is organized into eight chapters. This second edition remains almost the same as the previous volume except for some additions in Chapter 1 and reorganization of some chapters. Chapter 4 was revised to reflect the changes in the design of EEG machines; Chapters 5 and 6 were expanded to include more factual description of EEG records; and Chapters 7 and 8 were expanded and extensively revised to reflect major advances in signal analysis procedures. This book will be of interest to people with studies on EEG and those in the medical profession.

Preguntas frecuentes

¿Cómo cancelo mi suscripción?
Simplemente, dirígete a la sección ajustes de la cuenta y haz clic en «Cancelar suscripción». Así de sencillo. Después de cancelar tu suscripción, esta permanecerá activa el tiempo restante que hayas pagado. Obtén más información aquí.
¿Cómo descargo los libros?
Por el momento, todos nuestros libros ePub adaptables a dispositivos móviles se pueden descargar a través de la aplicación. La mayor parte de nuestros PDF también se puede descargar y ya estamos trabajando para que el resto también sea descargable. Obtén más información aquí.
¿En qué se diferencian los planes de precios?
Ambos planes te permiten acceder por completo a la biblioteca y a todas las funciones de Perlego. Las únicas diferencias son el precio y el período de suscripción: con el plan anual ahorrarás en torno a un 30 % en comparación con 12 meses de un plan mensual.
¿Qué es Perlego?
Somos un servicio de suscripción de libros de texto en línea que te permite acceder a toda una biblioteca en línea por menos de lo que cuesta un libro al mes. Con más de un millón de libros sobre más de 1000 categorías, ¡tenemos todo lo que necesitas! Obtén más información aquí.
¿Perlego ofrece la función de texto a voz?
Busca el símbolo de lectura en voz alta en tu próximo libro para ver si puedes escucharlo. La herramienta de lectura en voz alta lee el texto en voz alta por ti, resaltando el texto a medida que se lee. Puedes pausarla, acelerarla y ralentizarla. Obtén más información aquí.
¿Es EEG Technology un PDF/ePUB en línea?
Sí, puedes acceder a EEG Technology de R. Cooper, J. W. Osselton, J. C. Shaw en formato PDF o ePUB, así como a otros libros populares de Medicina y Medicina interna y diagnóstico. Tenemos más de un millón de libros disponibles en nuestro catálogo para que explores.

Información

Año
2014
ISBN
9781483192161
Edición
2
Categoría
Medicina
1

Origins of the Electroencephalogram

Publisher Summary

This chapter discusses the origins of the electroencephalogram (EEG). It was not until 1929 that Hans Berger published the first report of the EEG of man, as all the early work was done on animals. The chapter also discusses the electrical activity of the brain. Signals from the sense organs to the brain are transmitted along nerve fibers as series of pulses whose pulse recurrence frequency is dependent upon the amplitude of the external stimulus. As these nerve fibers from the receptor organs enter the cerebral cortex there can be profuse branching, so that the incoming pulses are spread over an appreciable area of cortex. The branched fibers do not connect directly into the neurons but terminate on cell bodies and dendrites by means of small swellings called synaptic knobs. The pulses are transmitted from the fibers across the synaptic membranes into the cell structure. Both neurons and nerve fibers are composed mainly of fluid contained within very thin membranes. Progressive transient disturbance of the resting potential along a fiber is used to transmit information from one end to the other.

1.1 HISTORICAL INTRODUCTION

In 1875 Richard Caton, a British physiologist, reported that: ‘Feeble currents of varying direction pass through the multiplier when electrodes are placed on two points of the external surface [of the brain], or one electrode on the grey matter, and one on the surface of the skull.’ Caton was investigating the electrical activity of the brains of cats, monkeys and rabbits using non-polarizable cortical electrodes connected to a galvanometer with optical magnification.
In the years that followed, several workers, some not knowing of Caton’s observations, investigated the electroencephalogram (EEG) of animals and showed changes of spontaneous activity and evoked responses to external stimuli. Considering the equipment available and the knowledge of electricity at that time, the experiments performed were of the highest order and can still be studied with profit. Caton, in 1887, worked with unanaesthetized unrestrained animals with light insulated wires, suspended from an overhead support, connecting the electrodes to the galvanometer. In 1890 Beck, in Poland, used non-polarizable electrodes and backed off the standing potentials with a Daniel cell and rheostat in one side of the galvanometer—no a.c. coupling here! In 1876 Danilevskey, in Kharkov, showed a change of the standing potential of the cortex in response to acoustic stimuli. The development in the 1930s of valve amplifiers with a.c. coupling undoubtedly impeded further study of the changes in steady potentials which the earlier workers had investigated so successfully. Only recently has this interesting aspect of the electrical activity of the brain been re-investigated.
In 1914 Cybulski recorded an epileptic seizure caused by cortical stimulation in a dog. Kaufmann, doing similar experiments in 1910, commented on the great difficulty he had in maintaining electrode contact during the seizure—a not uncommon complaint today! For a full account of these early experiments and scientists the reader is referred to Brazier (1961).
All the early work was done on animals and it was not until 1929 that Hans Berger published the first report of the electroencephalogram of man. Berger, a psychiatrist, working almost in isolation in Jena, had been investigating the EEG for a number of years. He used many different types of electrodes driving string or double coil galvanometers. One of the main reasons for his success, apart from his almost obsessive tenacity, was his working relationship with the neurosurgeons who provided him with patients in whom pieces of skull had been removed. This enabled him to get zinc plated needle electrodes into the epidural tissue very close to the surface of cortex. Although Berger published his first observations in 1929 with one or more papers in each subsequent year until 1938, many of them were ignored until Adrian and Matthews repeated the scalp investigations and published in 1934. Berger’s fourteen reports, with one correction in 1937 in which he reports an error due to 50 Hz mains interference, have been beautifully translated from the German by Gloor (1969). These show the depth of Berger’s work in which polygraphic recordings and evoked responses were studied in 1930, the relative merits of unipolar and bipolar recordings discussed in 1935 and frequency analysis described in 1936!
In much of the early work photography was used to record the deflections of the galvanometer light beam, but this was expensive; many workers had to read off the scale at regular intervals, and then plot the activity. In the 1930s, when the galvanometer was replaced by valve amplifiers with a.c. coupling, the activity was displayed on cathode-ray oscilloscopes and photographed. Pen writers were available in the 1940s and made it possible to have an immediate permanent record. The other great technical advance at this time was the use of the differential amplifier which eliminated much of the interference from external sources (Parr and Walter, 1943).
Since 1940 there has been little change of basic technique; most of the technical effort has been devoted to the construction of reliable multichannel recorders. A return to d.c. recording was achieved in the 1950s using transistor chopper amplifiers, but electrodes still presented a serious limitation to the stability that could be attained. This problem remains with us today (Chapter 2).

1.2 PHYSICAL STRUCTURE OF THE BRAIN

1.2.1 Gross anatomy

The brain consists of two hemispheres, the cerebellum and brainstem. The two hemispheres are separated by the longitudinal fissure across which there is a large connective band of fibres called the corpus callosum. The brainstem is a complex agglomeration of structures including the midbrain, pons medulla and reticular formation. Between the midbrain and cerebral hemispheres is the thalamus which is composed of groups of cells known as nuclei.
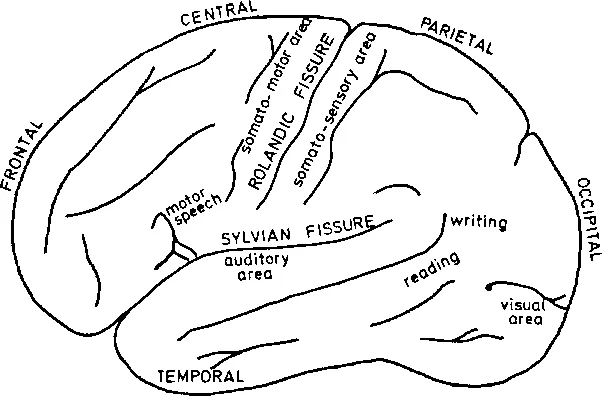
The outer surfaces of the cerebral hemispheres are composed of nerve cells (neurones) and form the cerebral cortex. These surfaces are highly convoluted and are separated into regions by a number of fissures (sulci) the largest of which are the Rolandic and Sylvian (Figure 1.1). This complex indentation increases the surface area (and thus the number of neurones) to more than twice that of a smooth sphere of the same size. Beneath the cortex nerve fibres lead to the other parts of the brain and body. Parts of the cortex are concerned with particular functions, for example the occipital region deals with visual information whilst auditory information is processed in the temporal lobe. Some of these regions are shown in Figure 1.1 Because of the colour, the regions composed of neurones, which includes the cerebral cortex, is known as grey matter; fibrous tissue is called white matter.
image

Figure 1.1 Lateral view of major areas of the brain

1.2.2 Physical structure of tissue

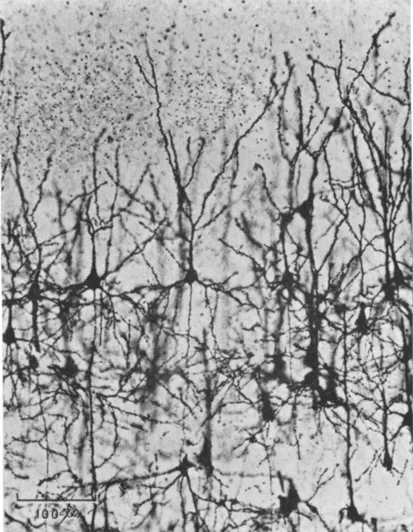
Microscopic examination of brain sections yields information only if the tissue is stained with a dye or with silver. The cerebral cortex then appears as an intricate network of fibres and neurones (Plate I). The white matter is seen to be composed of fibres, each wrapped in an insulating sheath of myelin. Electron-microscopic photographs show that the fibres and neurones are separated by a vast system of glial cells which outnumber the neurones by a factor of 10. All these methods of examination reveal only the physical positions of the fibres, neurones and glia, and not their functional relationships.
image

Plate I A section of the visual cortex of a cat showing a number of pyramidal neurones (reproduced from Organization of the Cerebral Cortex by D. A. Sholl by courtesy of Methuen)
The average thickness of cortex in man is 2.5 mm, the cortical area is about 2,300 cm2 and the neuronal density about 10 neurones/0001 mm3 (Sholl, 1956). The total number of neu...

Índice