![]()
Chapter 1
Multivariate Statistics
Chapter Outline
- 1.1 What Are Multivariate Statistics?
- 1.2 Decision Rules
- 1.3 Coverage of the Textbook
- 1.3.1 Multiple Regression
- 1.3.2 Logistic Regression
- 1.3.3 Multivariate Analysis of Variance
- 1.3.4 Discriminant Analysis
- 1.3.5 Cluster Analysis
- 1.3.6 Exploratory Factor Analysis
- 1.3.7 Path Analysis, Confirmatory Factor Analysis, and Structural Equation Modeling
- 1.3.8 Multilevel Linear Modeling
- 1.3.9 Propensity Score Analysis
- 1.4 Layout of the Textbook
- 1.5 Overarching Goal of the Textbook
1.1 What Are Multivariate Statistics?
Statistics can be categorized in various ways; one such way is based on the number of variables employed. Univariate statistics refers to statistics that employ just one variable. Bivariate statistics employ two variables. ‘Multivariate,’ by definition, means multiple variables. Even though, technically, ‘multiple variables’ may refer to only two variables, in the context of statistics, any procedure that simultaneously employs more than two variables is a multivariate procedure. As we’ll see, the multiple variables may come in the form of multiple independent variables, multiple dependent variables, or both. Many times, these multivariate procedures have a bivariate cousin, such as simple regression (with only one independent and one dependent variable) which segues into multiple regression (with two or more independent variables) or analysis of variance (with only one independent and one dependent variable) which segues into multivariate analysis of variance (with one or more independent variables and two or more dependent variables).
We can also think of multivariate statistics in terms of classic versus modern. Classic multivariate techniques include, for example, multivariate analysis of variance, multiple linear and logistic regression, discriminant analysis, cluster analysis, and exploratory factor analysis. Modern multivariate techniques, however, are (at least chronologically) statistical techniques that have recently become more common, such as multilevel linear modeling, structural equation modeling, and propensity score analysis.
By default of additional variables, multivariate statistics are more advanced, which may sometimes operationally be defined as more complex and/or more difficult to understand. However, the short-term pain of learning more advanced procedures equates to long-term gain of having a more powerful toolbox with which to work. An added bonus: Multivariate statistical procedures are just really fun. The types of questions that can be explored are nearly limitless, and the interpretations of the data are incredibly rich. Once you have one or two multivariate statistics under your belt, you’ll never want to run a t test or correlation again!
1.2 Decision Rules
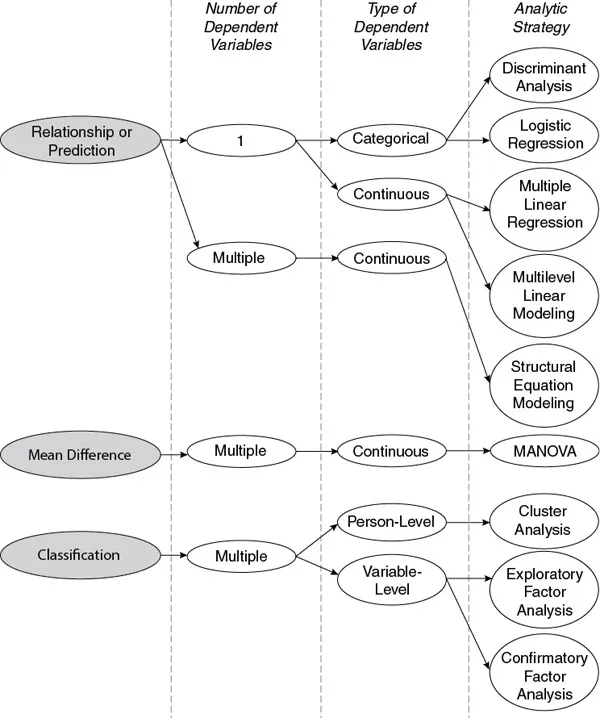
The decision rules for when to use which procedure are pretty straightforward in bivariate statistics. For example, if the goal is to determine mean differences, a t test or analysis of variance would be considered as a starting point. A relationship between two variables would be examined using a correlation or simple regression. The decision rules in multivariate statistics are not always as straightforward, an artifact of the complexity of these procedures and the additional elements that they entail. Regardless, some decision rules for consideration in planning your analysis are offered in Figure 1.1.
As seen in the figure, the primary purpose of the research question will guide the decision first. In the context of this textbook, questions of relationship/prediction, mean difference, and classification are covered. From there, the analytic decision is based on the number and types of variables in your model. For example, if the goal of my research is prediction and I have only one dependent categorical variable, there are two potential multivariate procedures that may be applicable: discriminant analysis and logistic regression. As we will later learn, the decision on which to use is based on both the type of independent variables and the extent to which the assumptions of the test are met. Thus, there is not necessarily one clear-cut decision on which multivariate procedure to select when the goal of my research is prediction and I have only one dependent categorical variable. Regardless, the intent of the diagram in Figure 1.1 is to point you in the right direction, understanding that the final procedure selected may entail more probing than a simple decision tree will allow for. What has not been illustrated on this decision tree is propensity score analysis (PSA). PSA is a preprocessor, so to speak, and allows for the matching of units prior to the primary analytic procedure being applied. Any of the procedures illustrated here can be applied to data that has been matched using propensity score.
1.3 Coverage of the Textbook
Chapters 2 and 3 cover data screening and offer a refresher on univariate and bivariate statistics. Data screening is a helpful precursor to many of the common assumptions that will be discussed in more detail in the text. Univariate and bivariate statistics will reacquaint you to several of the multivariate cousins with which you are already familiar. Chapters 3 through 11 are devoted to some of the most common multivariate analytical procedures: multiple regression; logistic regression; multivariate analysis of variance; discriminant analysis; cluster analysis; exploratory factor analysis; path analysis, confirmatory factor analysis, and structural equation modeling; and multilevel linear modeling. The final chapter is an introduction to propensity score analysis, a statistical procedure for matching. The book is written with a conceptual focus, not a technical one. However, there is an appendix that provides an introduction to matrix algebra, so that there is some scaffolding for the mathematics that underlie multivariate statistics.
1.3.1 Multiple Regression
Multiple linear regression is the multivariate extension of simple linear regression, which allows for prediction. Whereas simple linear regression includes one independent and one dependent variable, multiple linear regression includes two or more independent variables and one continuous dependent variable.
1.3.2 Logistic Regression
There are many outcomes that are worthy of investigation to determine predictions that are not continuous. In the case of categorical outcomes, such as pass/fail or win/lose, logistic regression is appropriate. When the outcome includes only two categories, binary logistic regression is appropriate. When the outcome includes more than two categories, multinomial logistic regression is appropriate. Logistic regression shares commonality with discriminant analysis but is more flexible in terms of the types of independent variables that can be applied to the logistic models. Both continuous and categorical (binary) variables can be used as independent variables in logistic regression.
1.3.3 Multivariate Analysis of Variance
Multivariate analysis of variance (MANOVA) is the multivariate cousin of analysis of variance. There are multiple MANOVA procedures, including single factor (i.e., one independent variable), factorial (two or more independent variables), and repeated measures designs that examine repeated outcomes.
1.3.4 Discriminant Analysis
When the goal is predicting group membership from continuous independent variables, discriminant analysis is appropriate. Discriminant analysis is often considered MANOVA in reverse.
1.3.5 Cluster Analysis
Cluster analysis is considered a ‘person-level’ approach to examining data, in that groups of units are classified based on the variables. Units (e.g., people or things) that share commonalities on the variables are clustered together. Cluster analysis may be helpful to determine profiles of users or consumers, for example.
1.3.6 Exploratory Factor Analysis
In comparison to cluster analysis, exploratory factor analysis (EFA) is a ‘variable-level’ approach to examining data, in that variables are grouped together based on the units. Variables that share commonalities on the units are grouped together. EFA may be helpful in determining evidence of construct validity, for example. EFA is a technique that is appropriate when you are in search of a structure to the data and there is minimal, if no, theoretical basis on which to derive the model.
1.3.7 Path Analysis, Confirmatory Factor Analysis, and Structural Equation Modeling
Path analysis, confirmatory factor analysis, and structural equation modeling are all procedures that fall under the general (and large) umbrella of latent variable modeling. These techniques are appropriate when you are in search of a structure to the data that is grounded in theory.
1.3.8 Multilevel Linear Modeling
Multilevel linear modeling is an extension of multiple regression that is appropriate when the data are nested in structure. Most data, if you think of it, are often nested. For example, children within classroom, employee within organization, athlete within team, resident within neighborhood…. The examples are nearly endless. Ignoring the context of the nesting may mask relationships, and multilevel linear modeling provides for a more complete contextualization of the situation.
1.3.9 Propensity Score Analysis
Propensity score analysis is a preparatory step to analyses that allows units to be matched on covariates and should be considered in situations where group analysis is of interest but randomization was not feasible. Thus, propensity score matching is a very powerful tool that can be used to circumvent self-selection. After the units are matched, any procedure (descriptive or inferential) that is appropriate given the data can be applied.
1.4 Layout of the Textbook
With the exception of the first few chapters, each chapter has been organized with the attempt to be consistent in how the material is presented. For example, each chap...