
eBook - ePub
Economic Indicators for East Asia
Input–Output Tables
This is a test
Compartir libro
- 232 páginas
- English
- ePUB (apto para móviles)
- Disponible en iOS y Android
eBook - ePub
Economic Indicators for East Asia
Input–Output Tables
Detalles del libro
Vista previa del libro
Índice
Citas
Información del libro
This report is a key resource for understanding the dynamic trade and production linkages of East Asian economies to support data-driven policy making and implementation. It updates a 2018 publication and explores a wider range of statistical and analytical indicators on the People's Republic of China; Hong Kong, China; Japan; Mongolia; the Republic of Korea; and Taipei, China. The tables and indicators presented are derived from the Multi-Regional Input–Output database maintained by the Asian Development Bank. Two companion volumes focus on South and Central Asia, and Southeast Asia and the Pacific.
Preguntas frecuentes
¿Cómo cancelo mi suscripción?
¿Cómo descargo los libros?
Por el momento, todos nuestros libros ePub adaptables a dispositivos móviles se pueden descargar a través de la aplicación. La mayor parte de nuestros PDF también se puede descargar y ya estamos trabajando para que el resto también sea descargable. Obtén más información aquí.
¿En qué se diferencian los planes de precios?
Ambos planes te permiten acceder por completo a la biblioteca y a todas las funciones de Perlego. Las únicas diferencias son el precio y el período de suscripción: con el plan anual ahorrarás en torno a un 30 % en comparación con 12 meses de un plan mensual.
¿Qué es Perlego?
Somos un servicio de suscripción de libros de texto en línea que te permite acceder a toda una biblioteca en línea por menos de lo que cuesta un libro al mes. Con más de un millón de libros sobre más de 1000 categorías, ¡tenemos todo lo que necesitas! Obtén más información aquí.
¿Perlego ofrece la función de texto a voz?
Busca el símbolo de lectura en voz alta en tu próximo libro para ver si puedes escucharlo. La herramienta de lectura en voz alta lee el texto en voz alta por ti, resaltando el texto a medida que se lee. Puedes pausarla, acelerarla y ralentizarla. Obtén más información aquí.
¿Es Economic Indicators for East Asia un PDF/ePUB en línea?
Sí, puedes acceder a Economic Indicators for East Asia de en formato PDF o ePUB, así como a otros libros populares de Economics y Macroeconomics. Tenemos más de un millón de libros disponibles en nuestro catálogo para que explores.
Información
Categoría
EconomicsCategoría
MacroeconomicsPART 1
THE DOMESTIC ECONOMY
This part explores some basic applications of input–output tables, which comprehensively detail the structure of a given economy and link both supply and demand components in a coherent and consistent framework. By combining input–output observations with standard economic theories, a picture of the domestic economy in terms of its structural composition, diversification, and linkages can be observed.
The data and analyses cover 25 economies in Asia and the Pacific across various sectors. A regional subgrouping and a sectoral aggregation are applied in most parts to streamline and enrich the discussions. Details on the sectors, including their differing levels of aggregation, as well as the economies and subgroupings thereof are provided in Appendixes 1 and 2 of this publication, respectively.
1.1 Economic Composition
Figure 1.1 shows the composition of the economy from the demand perspective, represented by the shares of private consumption, government consumption, gross capital formation, and exports in the total final demand for each economy for 2000 and 2018.
Figure 1.1: Composition of Final Demand by Economy, 2000 and 2018 (% of GDP)

GDP = gross domestic product; BAN = Bangladesh; BHU = Bhutan; BRU = Brunei Darussalam; CAM = Cambodia; FIJ = Fiji; HKG = Hong Kong, China; IND = India; INO = Indonesia; JPN = Japan; KAZ = Kazakhstan; KGZ = Kyrgyz Republic; KOR = Republic of Korea; LAO = Lao People’s Democratic Republic; MAL = Malaysia; MLD = Maldives; MON = Mongolia; NEP = Nepal; PAK = Pakistan; PHI = Philippines; PRC = People’s Republic of China; SIN = Singapore; SRI = Sri Lanka; TAP = Taipei,China; THA = Thailand; VIE = Viet Nam.
Source: Asian Development Bank. Multi-Regional Input–Output Tables (accessed July 2020).
In 2000, private consumption accounted for an average of 47.6% of the total final demand of the 25 economies; gross capital formation, 22.9%; exports, 17.6%; and government consumption, 12.8%. Private consumption had the largest share in the total final demand of most economies, ranging from 35.6% to 66.5%. Pakistan, Bangladesh, the Lao People’s Democratic Republic (Lao PDR), Cambodia, and Nepal had the highest shares, with at least 60% of total final demand accounted for by private consumption. On the other hand, the final demand of Maldives, Singapore, and Malaysia were dominated by exports rather than domestic consumption.
Compared to 2000, the composition of final demand in 2018 was less concentrated in private consumption. In addition to Maldives, Singapore, and Malaysia, the total final demands of other economies such as Viet Nam, Brunei Darussalam, and Taipei,China were more export-dominated than others. The total final demand of the rest of the economies remained largely driven by private consumption, with shares ranging from 32.9% to 68.3%.
On the production side, sectoral composition is described using the shares of each sector’s value-added in the total gross value-added (GVA) of the economy. This shows which activities the economy generates most of its income from. Across all subregions, the business services sector had the highest share in GVA: 37.6% in 2000 and 45.8% in 2018. In absolute terms, business services in East Asia had the highest value-added among all the subregional groups for both years, even though the sector’s share within the subregion decreased from 43.9% in 2000 to 39.7% in 2018 (Figure 1.2).
Figure 1.2: Sector Value-Added by Subregion, 2000 and 2018 (in $ millions and % of GVA)

GVA = gross value added.
Note: South and Central Asia includes Bangladesh, Bhutan, India, Kazakhstan, Kyrgyz Republic, Maldives, Nepal, Pakistan, and Sri Lanka. Southeast Asia and the Pacific includes Brunei Darussalam, Cambodia, Fiji, Indonesia, the Lao People’s Democratic Republic, Maldives, the Philippines, Singapore, Thailand, and Viet Nam. East Asia includes the People’s Republic of China; Hong Kong, China; Japan; Mongolia; the Republic of Korea; and Taipei,China.
Source: Asian Development Bank. Multi-Regional Input–Output Tables (accessed July 2020).
Meanwhile, the shares of business services sectors in the respective GVAs of South and Central Asia, Southeast Asia and the Pacific, and East Asia increased significantly from 2000 to at least a 40.0% share in 2018. On average, while the shares of the primary, low tech manufacturing, and public and personal services sectors decreased slightly, the share of the high and medium tech manufacturing sector decreased substantially (from 15.5% in 2000 to 9.7% in 2018). This decline was most pronounced in South and Central Asia, where the share of high and medium tech manufacturing dipped to 9.5% in 2018 from 36.1% in 2000. The decline in this subregion was, however, offset by an increase in the share of business services, which surged from 28.0% in 2000 to 48.1% in 2018.
Figure 1.3 shows the nominal values of each subregion’s GVA in 2000 and 2018, as well as their corresponding compounded annual growth rates between the two years. In terms of nominal GVC, East Asia had the largest economies. Within the subregion, the primary sector had the highest compounded growth rate (9.4%) between 2000 and 2018, as other sectors only grew at rates between 5.5% and 6.7% between the two years. In Southeast Asia and the Pacific, the services and low tech manufacturing sectors grew at impressive rates of 9.0% and 8.7%, respectively, compounded each year. Meanwhile, the growth of the high and medium tech manufacturing sector in Southeast Asia and the Pacific lagged by a couple of percentage points behind the low tech manufacturing sector, possibly due to maturing regional value chains for electronics and transport equipment. The same service- and manufacturing-led growth was observed in South and Central Asia as business services grew at 11.0% each year, followed by public and personal services at 9.4%, high and medium tech manufacturing at 9.1%, and low tech at 9.0%.
Figure 1.3: Sector Value-Added by Subregion, 2000 and 2018 (in $ millions and % CAGR)

CAGR = compounded annual growth rate.
Source: Asian Development Bank. Multi-Regional Input–Output Tables (accessed July 2020).
Figure 1.4 presents the shares of each sector within an economy to the total GVA of the said economy for 2000 and 2018. Points above the 45-degree line represent sectors which increased their shares in GVA between the two years (i.e., the sector value-added share in 2018 is greater than the share in 2000), whereas points below the line represent those which had declining shares between the period. Points on the diagonal line represent sectors with shares in GVA in 2000 not significantly different from their corresponding shares in 2018.
Figure 1.4: Shares of Total Economy Value-Added by Economy-Sector, 2000 and 2018 (% of GVA)
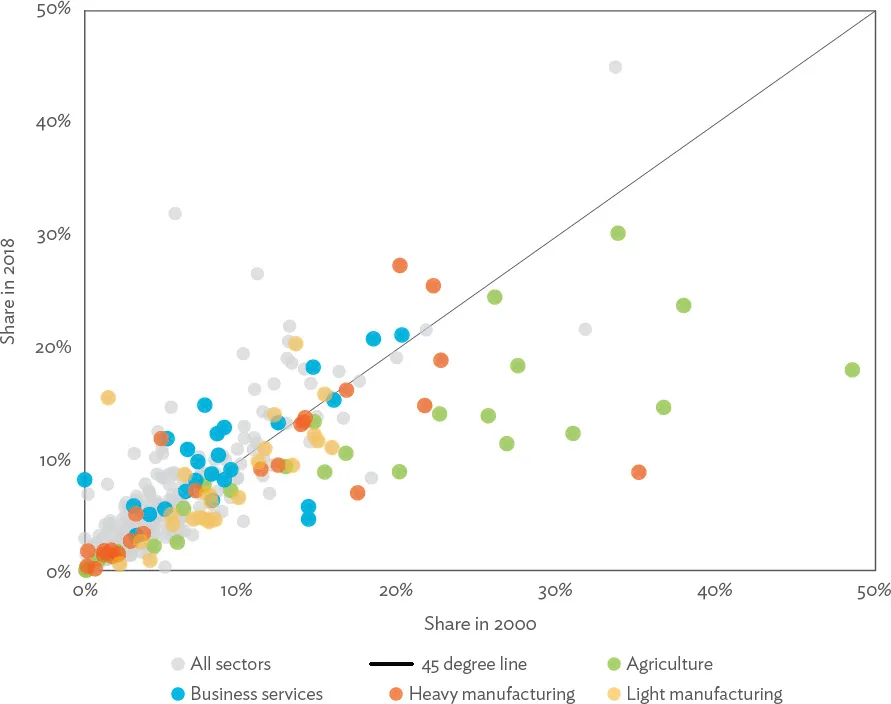
GVA = gross value added.
Source: Asian Development Bank. Multi-Regional Input–Output Tables (accessed July 2020).
The relatively larger number of blue points above the 45-degree line implies a general increase in the share of business services in GVA over time. Meanwhile, significant declines in the share of agriculture value-added were observed for most economies in the Asia and the Pacific region (green points below the line). Brunei Darussalam and Thailand were exceptions, as they retained their respective agriculture value-added shares close to their 2000 values. Some manufacturing activities had declining shares of value-added in the economy as well, most notably light manufacturing activities (yellow points below the line). This decline was more pronounced among economies that shifted toward other manufacturing activities increasingly supported by services. Driving the growth in the share of services value-added is the rapid expansion of the construction, travel, and tourism sectors, consistent with the demand-side observation of consumption-driven, export-oriented, and investment-led (mainly construction) growth in the region.
This pattern of structural transformation observed in the region – whereby agriculture’s share of output and employment first declines as the manufacturing industry’s share grows, followed by a decline in the share of manufacturing as services become more dominant due to “deindustrialization” – is similar to the experience of developed economies (ADB 2020).
1.2 Economic Diversification
The shifts in productive activities determine, to some extent, the level of diversification in a given economy. This analysis is particularly important for mineral- and commodity-based economies, which traditionally produce and export a very limited range of products. As the external environment becomes more volatile, the focus on extractive activities exacerbates risks from commodity cycles. Thus, over the years, diversification strategies for broader-based and more sustainable growth have attracted policy attention. Three diversification measures are presented in Figure 1.5; their definitions and calculation methods can be found in Appendix 3. In 2000, the economic activities of Brunei Darussalam, the Lao PDR, and the Kyrgyz Republic were more concentrated (less diversified) than other economies, regardless of the concentration index referred to. By 2018, the Lao PDR and the Kyrgyz Republic have significantly diversified their activities, whereas Brunei Darussalam further increased its concentration (except when using the Theil index). The trend for most developing economies in the region has been toward diversification, while that for the most developed economies such as Singapore; Taipei,China; Hong Kong, China; the Republic of Korea; and Japan has been toward more concentration.
Figure 1.5: Aggregate Measures of Value-Added Economic Diversification by Economy, 2000 and 2018

HH = Hirschman-Herfindahl concentration index; TH = Theil concentration index; GN = Gini concentration index; BAN = Bangladesh; BHU = Bhutan; BRU = Brunei Darussalam; CAM = Cambodia; FIJ = Fiji; HKG = Hong Kong, China; IND = India; INO = Indonesia; JPN = Japan; KAZ = Kazakhstan; KGZ = Kyrgyz Republic; KOR = Republic of Korea; LAO = Lao People’s Democratic Republic; MAL = Malaysia; MLD = Maldives; MON = Mongolia; NEP = Nepal; PAK = Pakistan; PHI = Philippines; PRC = People’s Republic of China; SIN = Singapore; SRI = Sri Lanka; TAP = Taipei,China; THA = Thailand; VIE = Viet Nam.
Note: Lig...