CompTIA Data+ Study Guide
Exam DA0-001
Mike Chapple, Sharif Nijim
- English
- ePUB (apto para móviles)
- Disponible en iOS y Android
CompTIA Data+ Study Guide
Exam DA0-001
Mike Chapple, Sharif Nijim
Información del libro
Build a solid foundation in data analysis skills and pursue a coveted Data+ certification with this intuitive study guide
CompTIA Data+ Study Guide: Exam DA0-001 delivers easily accessible and actionable instruction for achieving data analysis competencies required for the job and on the CompTIA Data+ certification exam. You'll learn to collect, analyze, and report on various types of commonly used data, transforming raw data into usable information for stakeholders and decision makers.
With comprehensive coverage of data concepts and environments, data mining, data analysis, visualization, and data governance, quality, and controls, this Study Guide offers:
- All the information necessary to succeed on the exam for a widely accepted, entry-level credential that unlocks lucrative new data analytics and data science career opportunities
- 100% coverage of objectives for the NEW CompTIA Data+ exam
- Access to the Sybex online learning resources, with review questions, full-length practice exam, hundreds of electronic flashcards, and a glossary of key terms
Ideal for anyone seeking a new career in data analysis, to improve their current data science skills, or hoping to achieve the coveted CompTIA Data+ certification credential, CompTIA Data+ Study Guide: Exam DA0-001 provides an invaluable head start tobeginningor accelerating a career as an in-demand data analyst.
Preguntas frecuentes
Información
Chapter 1
Today's Data Analyst
Welcome to the World of Analytics
Data
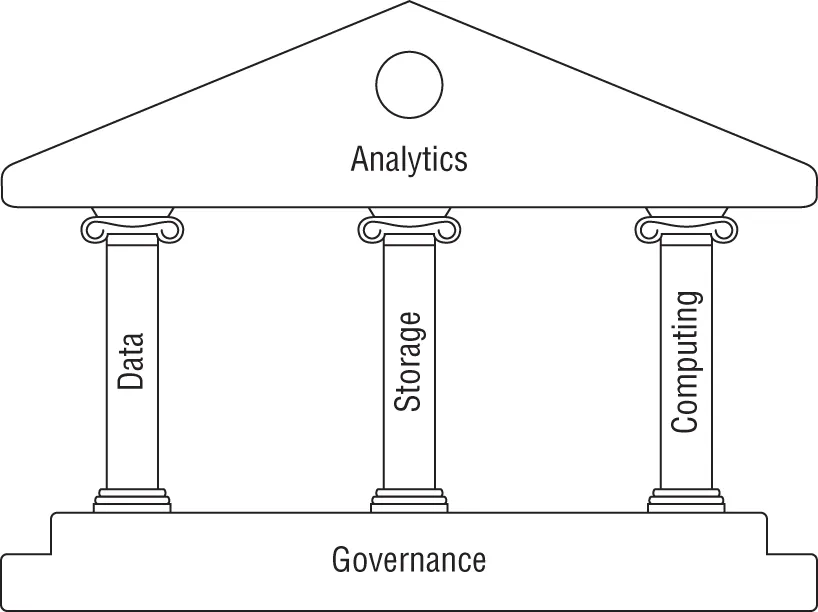
Storage
| Year | Cost per GB |
|---|---|
| 1985 | $169,900 |
| 1990 | $53,940 |
| 1995 | $799 |
| 2000 | $17.50 |
| 2005 | $0.62 |
| 2010 | $0.19 |
| 2015 | $0.03 |
| 2020 | $0.01 |