
eBook - ePub
Key Concepts and Techniques in GIS
Jochen Albrecht
This is a test
Compartir libro
- 120 páginas
- English
- ePUB (apto para móviles)
- Disponible en iOS y Android
eBook - ePub
Key Concepts and Techniques in GIS
Jochen Albrecht
Detalles del libro
Vista previa del libro
Índice
Citas
Información del libro
Key Concepts and Techniques in GIS is a concise overview of the fundamental ideas that inform geographic information science. It provides detailed descriptions of the concepts and techniques that anyone using GIS software must fully understand to analyse spatial data. Short and clearly focussed chapters provide explanations of:
- spatial relationships and spatial data
- the creation of digital data, the use and access of existing data, the combination of data
- the use of modelling techniques and the essential functions of map algebra
- spatial statistics and spatial analysis
- geocomputation - including discussion of neural networks, cellular automata, and agent-based modelling
Illustrated throughout with explanatory figures, the text also includes a glossary, cross referenced to discussion in the text. Written very much from a user?s perspective, Key Concepts and Techniques in GIS is highly readable refresher course for intermediate level students and practitioners of GIS in the social and the natural sciences.
Preguntas frecuentes
¿Cómo cancelo mi suscripción?
¿Cómo descargo los libros?
Por el momento, todos nuestros libros ePub adaptables a dispositivos móviles se pueden descargar a través de la aplicación. La mayor parte de nuestros PDF también se puede descargar y ya estamos trabajando para que el resto también sea descargable. Obtén más información aquí.
¿En qué se diferencian los planes de precios?
Ambos planes te permiten acceder por completo a la biblioteca y a todas las funciones de Perlego. Las únicas diferencias son el precio y el período de suscripción: con el plan anual ahorrarás en torno a un 30 % en comparación con 12 meses de un plan mensual.
¿Qué es Perlego?
Somos un servicio de suscripción de libros de texto en línea que te permite acceder a toda una biblioteca en línea por menos de lo que cuesta un libro al mes. Con más de un millón de libros sobre más de 1000 categorías, ¡tenemos todo lo que necesitas! Obtén más información aquí.
¿Perlego ofrece la función de texto a voz?
Busca el símbolo de lectura en voz alta en tu próximo libro para ver si puedes escucharlo. La herramienta de lectura en voz alta lee el texto en voz alta por ti, resaltando el texto a medida que se lee. Puedes pausarla, acelerarla y ralentizarla. Obtén más información aquí.
¿Es Key Concepts and Techniques in GIS un PDF/ePUB en línea?
Sí, puedes acceder a Key Concepts and Techniques in GIS de Jochen Albrecht en formato PDF o ePUB, así como a otros libros populares de Sciences physiques y Géographie. Tenemos más de un millón de libros disponibles en nuestro catálogo para que explores.
Información
1 | Creating Digital Data |
The creation of spatial data is a surprisingly underdeveloped topic in GIS literature. Part of the problem is that it is a lot easier to talk about tangibles such as data as a commodity, and digitizing procedures, than to generalize what ought to be the very first step: an analysis of what is needed to solve a particular geographic question. Social sciences have developed an impressive array of methods under the umbrella of research design, originally following the lead of experimental design in the natural sciences but now an independent body of work that gains considerably more attention than its counterpart in the natural sciences (Mitchell and Jolley 2001).
For GIScience, however, there is a dearth of literature on the proper development of (applied) research questions; and even outside academia there is no vendor-independent guidance for the GIS entrepreneur on setting up the databases that offthe-shelf software should be applied to. GIS vendors try their best to provide their customers with a starter package of basic data; but while this suffices for training or tutorial purposes, it cannot substitute for in-house data that is tailored to the needs of a particular application area.
On the academic side, some of the more thorough introductions to GIS (e.g. Chrisman 2002) discuss the history of spatial thought and how it can be expressed as a dialectic relationship between absolute and relative notions of space and time, which in turn are mirrored in the two most common spatial representations of raster and vector GIS. This is a good start in that it forces the developer of a new GIS database to think through the limitations of the different ways of storing (and acquiring) spatial data, but it still provides little guidance.
One of the reasons for the lack of literature – and I dare say academic research – is that far fewer GIS would be sold if every potential buyer knew how much work is involved in actually getting started with one’s own data. Looking from the ivory tower, there are ever fewer theses written that involve the collection of relevant data because most good advisors warn their mentees about the time involved in that task and there is virtually no funding of basic research for the development of new methods that make use of new technologies (with the exception of remote sensing where this kind of research is usually funded by the manufacturer). The GIS trade magazines of the 1980s and early 90s were full of eye-witness reports of GIS projects running over budget; and a common claim back then was that the development of the database, which allows a company or regional authority to reap the benefits of the investment, makes up approximately 90% of the project costs. Anecdotal evidence shows no change in this staggering character of GIS data assembly (Hamil 2001).
So what are the questions that a prospective GIS manager should look into before embarking on a GIS implementation? There is no definitive list, but the following questions will guide us through the remainder of this chapter.
- What is the nature of the data that we want to work with?
- Is it quantitative or qualitative?
- Does it exist hidden in already compiled company data?
- Does anybody else have the data we need? If yes, how can we get hold of it? See also Chapter 2.
- What is the scale of the phenomenon that we try to capture with our data?
- What is the size of our study area?
- What is the resolution of our sampling?
- Do we need to update our data? If yes, how often?
- How much data do we need, i.e. a sample or a complete census?
- What does it cost? An honest cost–benefit analysis can be a real eye-opener.
Although by far the most studied, the first question is also the most difficult one (Gregory 2003). It touches upon issues of research design and starts with a set of goals and objectives for setting up the GIS database. What are the questions that we would like to get answered with our GIS? How immutable are those questions – in other words, how flexible does the setup have to be? It is a lot easier (and hence cheaper) to develop a database to answer one specific question than to develop a general-purpose system. On the other hand, it usually is very costly and sometimes even impossible to change an existing system to answer a new set of questions.
The next step is then to determine what, in an ideal world, the data would look like that answers our question(s). Our world is not ideal and it is unlikely that we will gather the kind of data prescribed in this step, but it is interesting to understand the difference between what we would like to have and what we actually get. Chapter 3 will expand on the issues related to imperfect data.
1.1Spatial data
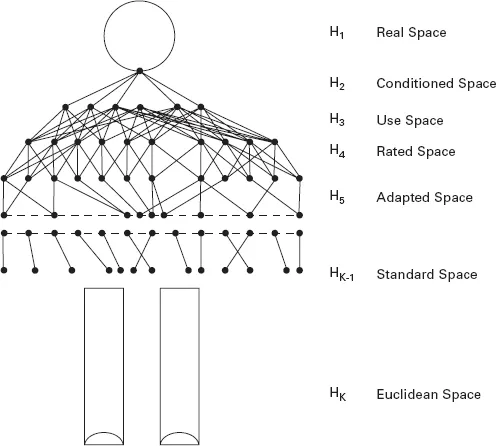
In its most general form, geographic data can be described as any kind of data that has a spatial reference. A spatial reference is a descriptor for some kind of location, either in direct form expressed as a coordinate or an address or in indirect form relative to some other location. The location can (1) stand for itself or (2) be part of a spatial object, in which case it is part of the boundary definition of that object.
In the first instance, we speak of a field view of geographic information because all the attributes associated with that location are taken to accurately describe everything at that very position but are to be taken less seriously the further we get away from that location (and the closer we can to another location).
The second type of locational reference is used for the description of geographic objects. The position is part of a geometry that defines the boundary of that object. The attributes associated with this piece of geographic data are supposed to be valid for all coordinates that are part of the geographic object. For example, if we have the attribute ‘population density’ for a census unit, then the density value is assumed to be valid throughout this unit. This would obviously be unrealistic in the case where a quarter of this unit is occupied by a lake, but it would take either lots of auxiliary information or sophisticated techniques to deal with this representational flaw. Temporal aspects are treated just as another attribute. GIS have only very limited abilities to reason about temporal relationships.
| Figure 1 | Object vs. field view (vector vs. raster GIS) |
This very general description of spatial data is slightly idealistic (Couclelis 1992). In practice, most GIS distinguish strictly between the two types of spatial perspectives – the field view that is typically represented using raster GIS, versus the object view exemplified by vector GIS (see Figure 1). The sets of functionalities differ considerably depending on which perspective is adopted.
1.2Sampling
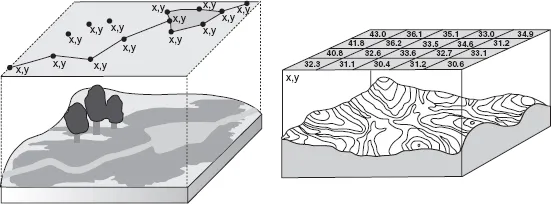
But before we get there, we will have to look at the relationship between the real-world question and the technological means that we have to answer it. Helen Couclelis (1982) described this process of abstracting from the world that we live in to the world of GIS in the form of a ‘hierarchical man’ (see Figure 2). GIS store their spatial data in a two-dimensional Euclidean geometry representation, and while even spatial novices tend to formalize geographic concepts as simple geometry, we all realize that this is not an adequate representation of the real world. The hierarchical man illustrates the difference between how we perceive and conceptualize the world and how we represent it on our computers. This in turn then determines the kinds of questions (procedures) that we can ask of our data.
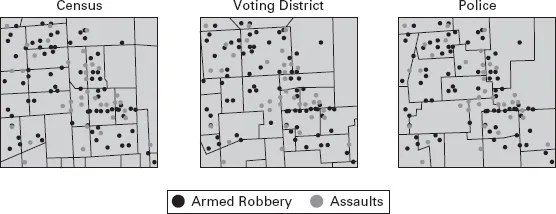
This explains why it is so important to know what one wants the GIS to answer. It starts with the seemingly trivial question of what area we should collect the data for – ‘seemingly’ because, often enough, what we observe for one area is influenced by factors that originate from outside our area of interest. And unless we have complete control over all aspects of all our data, we might have to deal with boundaries that are imposed on us but have nothing to do with our research question (the modifiable area unit problem, or MAUP, which we will revisit in Chapter 10). An example is street crime, where our outer research boundary is unlikely to be related to the city boundary, which might have been the original research question, and where the reported cases are distributed according to police precincts, which in turn would result in different spatial statistics if we collected our data by precinct rather than by address (see Figure 3).
| Figure 2 | Couclelis’ ‘Hierarchical Man’ |
In 99% of all situations, we cannot conduct a complete census – we cannot interview every customer, test every fox for rabies, or monitor every brown field (former industrial site). We then have to conduct a sample and the techniques involved are radically different depending on whether we assume a discrete or continuous distribution and what we believe the causal factors to be. We deal with a chicken-and-egg dilemma here because the better our understanding of the research question, the more specific and hence appropriate can be our sampling technique. Our needs, however, are exactly the other way around. With a generalist (‘if we don’t know anything, let’s assume random distribution’) approach, we are likely to miss the crucial events that would tell us more about the unknown phenomenon (be it West Nile virus or terrorist chatter).
| Figure 3 | Illustration of variable source problem |
Most sampling techniques apply to so-called point data; i.e., individual locations are sampled and assumed to be representative for their immediate neighborhood. Values for non-sampled locations are then interpolated assuming continuous distributions. The interpolation techniques will be discussed in Chapter 10. Currently unresolved are the sampling of discrete phenomena, and how to deal with spatial distributions along networks, be they river or street networks.
Surprisingly little attention has been paid to the appropriate scale for sampling. A neighborhood park may be the world to a squirrel but is only one of many possible hunting grounds for the falcon nesting on a nearby steeple (see Figure 4). Every geographic phenomenon can be studied at a multitude of scales but usually only a small fraction of these is pertinent to the question at hand. As mentioned earlier, knowing what one is after goes a long way in choosing the right approach.
Given the size of the study area, the assumed form of spatial distribution and scale, and the budget available, one eventually arrives at a suitable spatial resolution. However, this might be complicated by the fact that some spatial distributions change over time (e.g. people on the beach during various seasons). In the end, one has to make sure that one’s sampling represents, or at least has a chance to represent, the phenomenon that the GIS is supposed to serve.
1.3Remote sensing
Without wasting too much time on the question whether remotely sensed data is primary or secondary data, a brief synopsis of the use of image analysis techniques as a source for spatial data repositories is in order. Traditionally, the two fields of GIS and remote sensing were cousins who acknowledged each other’s existence but otherwise stayed clearly away from each other. The widespread availability of remotely sensed data and especially pressure from a range of application domains have forced the two communities to cross-fertilize. This can be seen in the added functionalities of both GIS and remote sensing packages, although the burden is still on the user to extract information from...