Interpretation of Cardiac Pathophysiology from Pressure Waveform Analysis
Morton J. Kern, Michael J. Lim, James A. Goldstein, Morton J. Kern, Michael J. Lim, James A. Goldstein
This is a test
This is a test
Compartir libro
English
ePUB (apto para móviles)
Disponible en iOS y Android
eBook - ePub
Hemodynamic Rounds
Interpretation of Cardiac Pathophysiology from Pressure Waveform Analysis
Morton J. Kern, Michael J. Lim, James A. Goldstein, Morton J. Kern, Michael J. Lim, James A. Goldstein
Detalles del libro
Vista previa del libro
Índice
Citas
Información del libro
The essential resource on cardiac hemodynamics—now in a new edition
Hemodynamic Rounds, Fourth Edition is intended to help cardiologists, cardiovascular fellowship trainees, residents and other members of the medical community enhance their understanding of cardiac physiology and its associated hemodynamic presentations in health and disease. This includes the basic principles of flow and pressure measurements, systemic as well as coronary hemodynamics in normal and diseased states, and changes in hemodynamics following interventional procedures ranging from TAVI and valvuloplasty to stent placement.
Like its popular predecessors, this new edition draws on case studies to illustrate characteristic cardiac hemodynamic findings and discusses the essential methods used in interpreting pressure waveforms as a diagnostic and monitoring tool.
The text is organized into chapters on specific areas of the heart, common cardiac pathophysiologic conditions, and hemodynamic situations resulting from different therapeutic procedures. It includes discussions of both normal and abnormal pressure waveforms. This new edition has been revised throughout to include brand new content on aortic and mitral valve stenosis and regurgitation as well as TAVI and mitral clip hemodynamics. Highlights include:
Essential and easy to understand resource for those required to interpret cardiac blood flow and blood pressure tracings
Covers hemodynamic assessment by cardiac disorder, plus the bedside applications of hemodynamics
Revised throughout and includes brand new content on valve stenosis and regurgitation and TAVI and mitral clip hemodynamics
Hemodynamic Rounds: Interpretation of Cardiac Pathophysiology from Pressure Waveform Analysis, Fourth Edition is an indispensable tool for all physicians, nurses, and students responsible for measuring and interpreting cardiac waveforms in cardiac diagnosis and monitoring.
Preguntas frecuentes
¿Cómo cancelo mi suscripción?
Simplemente, dirígete a la sección ajustes de la cuenta y haz clic en «Cancelar suscripción». Así de sencillo. Después de cancelar tu suscripción, esta permanecerá activa el tiempo restante que hayas pagado. Obtén más información aquí.
¿Cómo descargo los libros?
Por el momento, todos nuestros libros ePub adaptables a dispositivos móviles se pueden descargar a través de la aplicación. La mayor parte de nuestros PDF también se puede descargar y ya estamos trabajando para que el resto también sea descargable. Obtén más información aquí.
¿En qué se diferencian los planes de precios?
Ambos planes te permiten acceder por completo a la biblioteca y a todas las funciones de Perlego. Las únicas diferencias son el precio y el período de suscripción: con el plan anual ahorrarás en torno a un 30 % en comparación con 12 meses de un plan mensual.
¿Qué es Perlego?
Somos un servicio de suscripción de libros de texto en línea que te permite acceder a toda una biblioteca en línea por menos de lo que cuesta un libro al mes. Con más de un millón de libros sobre más de 1000 categorías, ¡tenemos todo lo que necesitas! Obtén más información aquí.
¿Perlego ofrece la función de texto a voz?
Busca el símbolo de lectura en voz alta en tu próximo libro para ver si puedes escucharlo. La herramienta de lectura en voz alta lee el texto en voz alta por ti, resaltando el texto a medida que se lee. Puedes pausarla, acelerarla y ralentizarla. Obtén más información aquí.
¿Es Hemodynamic Rounds un PDF/ePUB en línea?
Sí, puedes acceder a Hemodynamic Rounds de Morton J. Kern, Michael J. Lim, James A. Goldstein, Morton J. Kern, Michael J. Lim, James A. Goldstein en formato PDF o ePUB, así como a otros libros populares de Médecine y Cardiologie. Tenemos más de un millón de libros disponibles en nuestro catálogo para que explores.
1 Principles of Normal Physiology and Pathophysiology
James A. Goldstein and Morton J. Kern
Pathophysiologic derangements of cardiac anatomic components and mechanics manifest as “cardinal” cardiovascular symptoms, most of which are reflected in distinct hemodynamic disturbances. These symptomatic–hemodynamic constellations include (i) dyspnea, reflecting pulmonary venous congestion; (ii) fatigue, attributable to inadequate cardiac output; (iii) syncope, resulting from transient profound hypotension; and (iv) peripheral edema, related to systemic venous congestion. Chest pain typically suggesting ischemia does not usually result directly from primary hemodynamic derangements, does not lend itself to this anatomic–pathophysiologic hemodynamic approach, and will not be addressed in these discussions.
It is important to emphasize that these symptom groups in isolation are nonspecific. Identical complaints reflecting disparate pathophysiologic processes can occur due to a variety of mechanisms. For example, dyspnea is an expected symptomatic manifestation of pulmonary venous hypertension attributable to a spectrum of left-heart derangements, the underlying mechanisms of which vary greatly (e.g., mitral stenosis, mitral regurgitation, left ventricular cardiomyopathy, etc.). The treatments and prognoses also vary greatly. Dyspnea is also commonly of pulmonary origin, with circumstances in which the heart may be completely normal or impacted only as an innocent bystander (e.g., cor pulmonale).
Similarly, peripheral edema and ascites reflect systemic venous congestion resulting from a spectrum of right-heart failure mechanisms (e.g., tricuspid valve disease, right ventricular cardiomyopathy, pericardial disorders, etc.). However, edema may also develop under conditions with normal systemic venous pressures, as may occur in patients with cirrhotic liver disease, nephrotic syndrome, inferior vena cava (IVC) compression, and so on. Thus, for cardiovascular assessment, symptoms and signs must be characterized according to the underlying anatomic–pathophysiologic mechanisms.
To establish an anatomic–pathophysiologic differential diagnosis, first consider the anatomic cardiac components (myocardium, valves, arteries, pericardium, and conduction tissue) that may be involved and then focus on the fundamental mechanisms that impact each anatomic component, finally asking how such anatomic–pathophysiologic derangements and hemodynamic perturbations are reflected in the symptoms, physical signs, and invasive waveforms.
Cardiac Mechanical Function and Hemodynamics
Hemodynamic assessment is an integral part of the anatomic–physiologic approach to circulatory pathophysiology, employing bedside examination with confirmatory or complementary invasive and noninvasive (echo-Doppler data) hemodynamic information.
The purpose of the cardiovascular system is to generate cardiac output to perfuse the body. However, although perfusion is the heart’s “bottom line,” perfusion depends on pressure to drive the blood through the tissues. Organ perfusion is determined by arterial driving pressure modulated by vascular bed resistances. The regulation of the circulation (pressure and flow) can be understood by the application of Ohm’s law–related resistance to pressure and flow. In classical physics applied to an electrical circuit, Ohm’s law is expressed as:
where ∆V is the driving voltage potential difference across the circuit, I is the current flow, and R is the circuit resistance. Thus, circuit output or current flow is a function of the “driving” voltage divided by circuit resistance, or I = ∆V/R. Translating Ohm’s law to the cardiac circulation, blood pressure (dV) = cardiac output (I) × systemic vascular resistance (R) and can be applied to the systemic circulation or to individual organ beds.
The key components of blood pressure can be further considered. Thus, cardiac output (CO) = heart rate (HR) × stroke volume (SV). Furthermore, SV is a function of three cardiac mechanisms: preload, afterload, and contractility. Systemic vascular resistance is determined by total blood volume and vascular tone (a function of intrinsic vessel contraction or relaxation interacting with systemic and local neuro-hormonal influences, metabolic factors, other vasomotor mediators, etc.).
Fundamentals of Hemodynamic Waveforms: The Wiggers Diagram
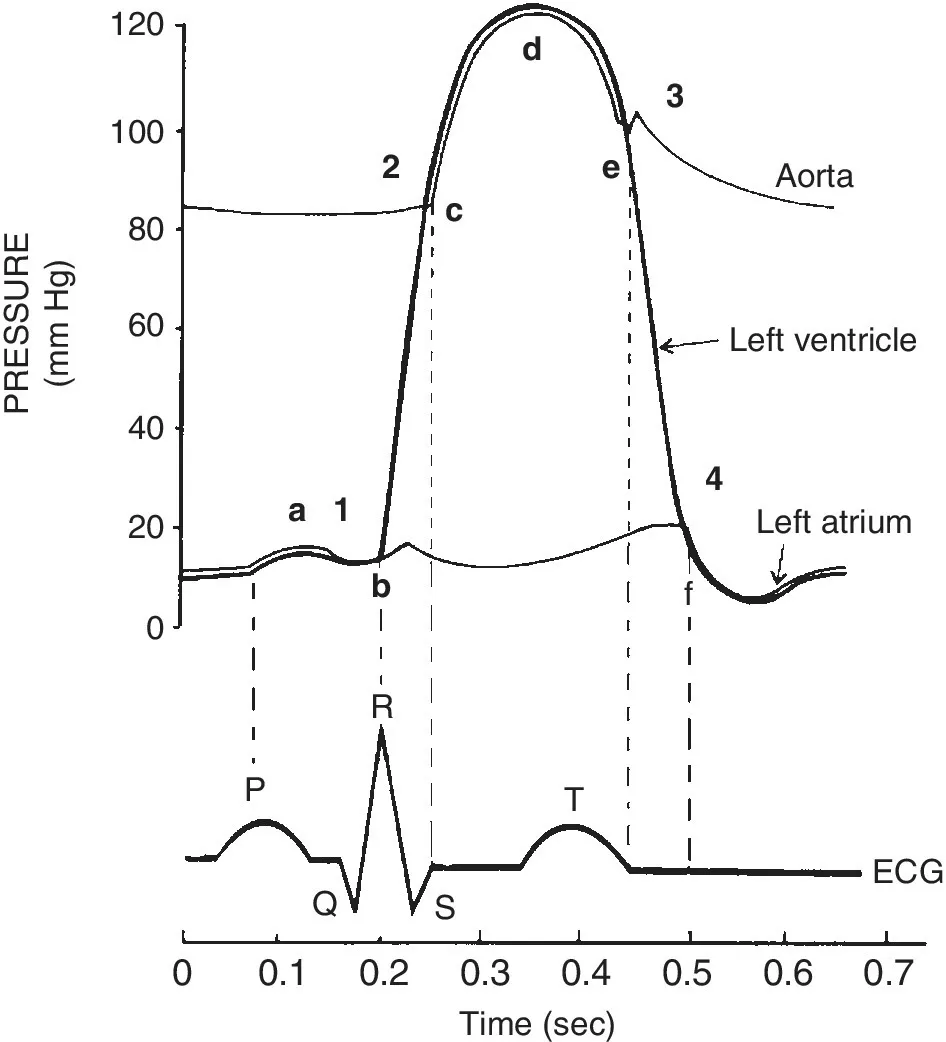
All pressure waves of the cardiac cycle can be understood by reviewing and knowing how electrical and mechanical activity of the heart’s contraction and relaxation are related. Every electrical activity is followed normally by a mechanical function (either contraction or relaxation), resulting in a pressure wave. The timing of mechanical events can be obtained by looking at the electrocardiogram (ECG) and corresponding pressure tracing (Figure 1.1) [1].
Figure 1.1 The Wiggers diagram.
Source: Opie 2015 [1]. Reproduced with permission of Elsevier.
The ECG P wave is responsible for atrial contraction, the QRS for ventricular activation, and the T wave for ventricular relaxation. The periods between electrical activation reflect impulse transmission times to different areas of the heart. These time delays permit the mechanical functions to be in synchrony and generate efficient cardiac output and pressure. When the normal sequence of contraction and relaxation of the heart muscle is disturbed by arrhythmia, cardiac function is inefficient or ineffective, as demonstrated on the various pressure waveforms associated with the arrhythmia.
The cardiac cycle begins with the P wave. This is the electrical signal for atrial contraction. The atrial pressure wave (A wave; Figure 1.1, #1) follows the P wave by 30–50 msec. Following the A wave peak, the atrium relaxes and pressure falls, generating the X descent (point b). The next event is the depolarization of the ventricles with the QRS (point b). The left ventricular (LV) pressure after the A wave is called the end-diastolic pressure (LVEDP). It can be denoted by a vertical line dropped from the R wave to the intersection of the LV pressure (point b). About 15–30 msec after the QRS, the ventricles contract and the LV (and right ventricular, RV) pressure increases rapidly. This period of rise in LV pressure without change in LV volume is called the isovolumetric contraction period (interval b–c). When LV pressure rises above the pressure in the aorta, the aortic valve opens and blood is ejected into the circulation (point c). This point is the beginning of systole. Some hemodynamicists include isovolumetric contraction as part of systole.
About 200–250 msec after the QRS, at the T wave, repolarization starts and the heart begins relaxing. By the end of the T wave (point e), the LV contraction has ended and LV relaxation produces a fall in the LV (and aortic pressure). When the LV pressure falls below the aortic pressure, the aortic valve closes (point e). Systole concludes and diastole begins. After aortic valve closure, the ventricular pressure continues to fall. When the LV pressure falls below the left atrial (LA) pressure, the mitral valve opens and the LA empties into the LV (point f). The period from aortic valve closure to mitral valve opening is call the isovolumetric relaxation period (interval e–f). Diastole is the period from mitral valve opening to mitral valve closing.
Observing the atrial pressure wave across the cardiac cycle, it should be noted that after the A wave, pressure slowly rises across systole, continuing to increase until the end of systole when the pressure and volume of the LA are nearly maximal, producing a ventricular filling wave (V wave). The V wave (point f, #4) peak is followe...