![]()
CHAPTER 1
Demystifying Forecasting: Myths versus Reality
It has been an exciting time for the field of demand forecasting. All the elements are in place to support demand forecasting from a fact-based perspective. Advanced analytics has been around for well over 100 years and data collection has improved significantly over the past decade, and finally data storage and processing capabilities have caught up. It is not uncommon for companies' data warehouses to capture and store terabits of information on a daily basis, and parallel processing and grid processing have become common practices. With improvements in data storage and processing over the past decade, demand forecasting is now poised to take center stage to drive real value within the supply chain.
What's more, predictive analytics has been gaining wide acceptance globally across all industries. Companies are now leveraging predictive analytics to uncover patterns in consumer behavior, measure the effectiveness of their marketing investment strategies, and optimize financial performance. Using advanced analytics, companies can now sense demand signals associated with consumer behavior patterns and shape future demand using predictive analytics and data mining technology. They can also measure how effective their marketing campaigns are in driving consumer demand for their products and services, and therefore they can optimize their marketing spending across their product portfolios. As a result, a new buzz phrase has emerged within the demand forecasting discipline: sensing, shaping, and responding to demand, or what is now being called demand-driven forecasting.
With all these improvements, there has been a renewed focus on demand forecasting as the key driver of the supply chain. As a result, demand forecasting methods and applications have been changing, emphasizing predictive analytics using what-if simulations and scenario planning to shape and proactively drive, rather than react to, demand. The widespread acceptance of these new methods and applications is being driven by pressures to synchronize demand and supply to gain more insights into why consumers buy manufacturers' products. The wide swings in replenishment of demand based on internal shipments to warehouses and the corresponding effects on supply can no longer be ignored or managed effectively without great stress on the upstream planning functions within the supply chain.
New enabling technologies combined with data storage capabilities have now made it easier to store causal factors that influence demand in corporate enterprise data warehouses; factors may include price, advertising, in-store merchandising (e.g., displays, features, features/displays, temporary price increases), sales promotions, external events, competitor activities, and others, and then use advanced analytics to proactively shape future demand utilizing what-if analysis or simulations based on the parameters of the models to test different marketing strategies. The focus on advanced analytics is driven primarily by the need of senior management to gain more insights into the business while growing unit volume and profit with fewer marketing dollars. Those companies that are shaping future demand using what-if analysis are experiencing additional efficiencies downstream in the supply chain. For example, senior managers are now able to measure the effects of a 5 percent price increase with a good degree of accuracy and ask additional questions, such as: What if we increase advertising by 10 percent and add another sales promotion in the month of June? How will that affect demand both from a unit volume and profit perspective? Answers to such questions are now available in real time for nonstatistical users employing advanced analytics with user-friendly point-and-click interfaces. The heavy-lifting algorithms are embedded behind the scenes, requiring quarterly or semiannual recalibration by statisticians who are either on staff or hired through outside service providers.
The results of these what-if simulations are used to enhance or shape future demand forecasts by validating or invalidating assumptions using domain knowledge, analytics, and downstream data from sales and marketing rather than gut-feeling judgment.
With all the new enhancements, there are still challenges ahead for demand forecasting. Many organizations struggle with how to analyze and make practical use of the mass of data being collected and stored. Others are still struggling to understand how to synchronize and share external information with internal data across their technology architectures. Nevertheless, they are all looking for enterprise-wide solutions that provide actionable insights to make better decisions that improve corporate performance through improved intelligence.
Improvements in demand forecasting accuracy have been a key ingredient in allowing companies to gain exponential performance in supply chain efficiencies. Unfortunately, demand forecasting still suffers from misconceptions that have plagued the discipline for decades and have become entrenched in many corporate cultures. The core misconception that has troubled companies for years is that simple forecasting methods, such as exponential smoothing, which measure the effects of trend, seasonality, and randomness (or what is known as unexplained randomness, or noise), can be used to create statistical baseline forecasts and enhanced (or improved) by adding gut-feeling judgmental overrides. Those overrides usually are based on inflated assumptions reflecting personal bias. The second misconception is that these judgmental overrides can be managed at aggregated levels (higher levels in the product hierarchy) without paying attention to the lower-level mix of products that make up the aggregate. The aggregation is required to manage the large scale of data that usually span multiple geographic regions, markets, channels, brands, product groups, and products (stock-keeping units [SKUs]). The sheer size of the data makes it difficult to manage the overrides at the lowest level of granularity. Companies compromise; they make judgmental overrides at higher aggregate levels and disaggregate it down using Excel spreadsheets and very simplistic, static averaging techniques. In other words, the averages are constant into the future and do not account for seasonality and trends at the lower levels. In many cases, products within the same product group are trending in different directions.
Another misconception is political bias based on the needs of the person or purpose of the department making the judgmental overrides. For example, depending on the situation, some sales departments will lower the forecast to reduce their sales quota in order to ensure that they make bonus. This is known as sandbagging. Other sales departments that have experienced lost sales due to back orders (not having the inventory available in the right place and the right time) will raise the forecast in the hopes of managing inventory levels via the sales department forecast. This method creates excess inventory as the operations planning department is also raising safety stocks to cover the increase in the sales department forecast. The problem is compounded, creating excess finished goods inventory, not to mention increased inventory carrying costs. The finance department always tries to hold to the original budget or financial plan, particularly when sales are declining. Finally, the marketing department almost always raises its forecast in anticipation of the deployment of all the marketing activities driving incremental sales. The marketing department also receives additional marketing investment dollars if it shows that its brands and products are growing. So marketing tends to be overly optimistic with marketing forecasts, particularly when they raise the forecast to reflect sales promotions and/or marketing events.
These misconceptions are difficult to overcome without a great deal of change management led by a corporate “champion.” A corporate champion is usually a senior-level manager (e.g., director, vice president, or higher) who has the authority to influence change within the company.
This person usually has the ear of the chief executive officer, chief financial officer, or chief marketing officer and is also regarded within the organization as a domain knowledge expert in demand forecasting with a broad knowledge base that spans multiple disciplines. He or she usually has some practical knowledge of and experience in statistical forecasting methods and a strong understanding of how demand forecasting affects all facets of the company.
The purpose of this book is to put to rest many of the misconceptions and bad habits that have plagued the demand forecasting discipline. Also, it provides readers with a structured alternative that combines data, analytics, and domain knowledge to improve the overall performance of the demand forecasting process of a company.
DATA COLLECTION, STORAGE, AND PROCESSING REALITY
Over the past ten years, we have seen a great improvement in data storage. For example, companies that only a few years ago were struggling with 1 terabyte of data are now managing in excess of 68 terabytes of data with hundreds of thousands of SKUs. In fact, you can purchase an external hard drive that fits in your pocket for your personal computer (PC) or laptop that can store 1 terabyte of data for less than $150. Data storage costs have gone down substantially, making it easier to justify the collection of additional data in a more granular format that reflects complex supply chain networks of companies.
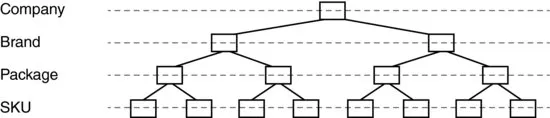
Most companies review their forecasts in a product hierarchy that mirrors the way they manage their supply chain or product portfolio. In the past, product hierarchies in most companies were simple, reflecting the business at the national, brand, product group, product line, and SKU levels. These product hierarchies ranged from hundreds to a few thousand SKUs, spanning a small number of countries or sales regions and a handful of distribution points, making them fairly easy to manage (see Figure 1.1).
During the past two decades, however, many industries have gone through major consolidations. Larger companies found it easier to swallow up smaller companies to increase their economies of scale from a sales, marketing, and operations perspective rather than growing their business organically. They realized additional benefits as they flushed out inefficiencies in their supply chains while increasing their revenue and global reach. Unfortunately, with all this expansion came complexities in the way they needed to view their businesses.
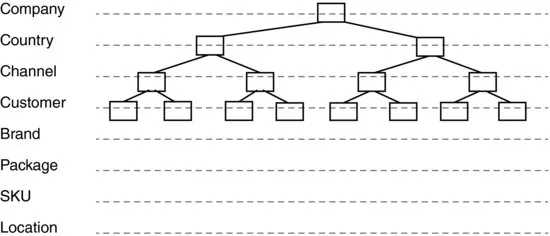
Today, with global reach across multiple countries, markets, channels, brands, and products, the degree of granularity has escalated tenfold or more (see Figure 1.2). Product portfolios of companies have increased dramatically in size, and the SKU base of companies has expanded into the thousands and in some cases hundreds of thousands. It is not unusual to see companies with more than 10,000 SKUs that span across 100 or more countries.
Further escalation occurred as marketing departments redefined their consumer base by ethnicity, channels of distribution, and purchase behavior. The resulting increased granularity has further complicated company product hierarchies. All this proliferation in business complexity has made it difficult not only to manage the data but also to process the data in a timely manner.
Given all this complexity and increase in the number of SKUs, Excel spreadsheets are no longer viable tools to manage the demand forecasting process. Excel is simply not scalable enough to handle the data and processing requirements. Excel's analytics capabilities are limited to some time series techniques and basic simple regression that model trend, seasonality, and unexplainable historical patterns. Nevertheless, over 40 percent of forecasters still use Excel to do forecasting, according to several surveys conducted over the past decade by academic- and practitioner-based organizations.
In fact, a survey conducted by Purdue University and the SAS Institute found that over 85 percent of the respondents still use Excel as a workaround to existing enterprise resource planning (ERP) and supply chain management solutions due to the lack of ad hoc reporting capabilities and other related functionality.1
Over the past several years, the introduction of Windows NT (New Technology) servers, parallel processing, and grid computing has significantly improved the speed of processing data and running analytics on large volumes of data. Sophisticated algorithms now can be executed on a large scale using advanced statistics and business rules across company product hierarchies for hundreds of thousands of products. In fact, a large majority of products can be forecasted automatically using new enabling technologies that allow forecasters to focus on growth products that are more dynamic than mature products due to their marketplace competitiveness. Rather than spending 80 percent of their time identifying, collecting, cleansing, and synchronizing data, forecasters can now focus on those products that need more attention due to market dynamics and other related factors.
Recent development in the area of master data management and big data (both structured and unstructured) has helped standardize data structures, making it easier to manage information and untangle the years of mismanaged data storage. With all these new enhancements to data collection and processing, forecasters no longer need to worry about data quality or data availability. We can now collect, store, and process millions of data series in batch overnight and hundreds of thousands in real time in a matter of minutes and hours. Data are also streaming into enterprise data warehouses in real time via the Internet, providing forecasters with monitoring, tracking, and reporting capabilities throughout the workday.
All these improvements in data collection, storage, and processing speed have eliminated many of the barriers that prevented companies from conducting large-scale forecasts across complex supply chain networks and product hierarchies. Companies can no longer use the excuses that data availability is limited or that running statistical models across their product portfolios takes too long. Unfortunately, companies still are having problems understanding all this information. Fortunately, uncovering actionable insights in a timely manner to make better decisions is becoming easier as significant gains have been made with new technologies in data mining and text mining. Managing information and using high-performance analytics (HPA) are enabling organizations to gain competitive advantage through timely insights and precise answers to complex business questions. These insights are being utilized to support the decision-making process and will only improve over the next several years.
ART-OF-FORECASTING MYTH
Contrary to what you have heard or believe, there is no art in forecasting; rather the art lies in statistics and domain knowledge. Domain knowledge is not the art of making judgmental overrides based on inflated bias assumptions to simple statistical baseline forecasts; domain knowledge refers to the act of defining and uncovering market opportunities based on knowledge (business acumen). In other words, forecasting uses the combination of domain knowledge (business experience) and analytics to validate or invalidate those assumptions. It is ironic that although we use exact science to manufacture products along structured guidelines with specifications that are within a .001 tolerance range, we use our gut-feeling judgment to forecast demand for those same products. I have an advanced degree in applied econometrics and more than 26 years of experience as a forecast practitioner with more than six companies, and I still cannot take my gut-feeling judgment and turn it into a number. I need to access the data and conduct the analytics to validate my assumptions. In other words, come up with a hypothesis, find the data, and conduct the analytics to determine whether you can reject the hypothesis. Then use the results to make adjustments to the statistical baseline forecast or, better yet, build those assumptions into the statistical baseline forecast by adding the additional data and revising the analytics.
Today, some global consumer packaged goods (CPG) companies like Nestlé, Dow, Cisco, and Procter & Gamble are switching to a demand-driven structured process with more focus on data, analytics, and domain knowledge. By doing so, they are improving their demand forecast accuracy almost immediately, which leads to positive improvements in customer service and lowered inventories. With the support of a new demand-driven enabling technology platform, these CPG companies are able to exceed their demand forecast accuracy projections by double digits. They learn quickly that demand forecast accuracy improvement drives reductions in safety stock, inventory days on hand, storage costs, and freight costs. By gaining a few points of accuracy at the national level, they are able to experience supply chain savings immediately. Their accurate demand forecasts have even benefited areas such as efficient route planning. According to these CPG manufacturers, the accuracy can be driven by a change from a 50,000-foot view of demand forecasts to a more detailed look. Also, the ability to sense demand signals associated with sales promotion lifts using more advanced analyti...