Psychology
Scatter Plots
Scatter plots are visual representations of the relationship between two variables. In psychology, they are often used to examine the correlation between different psychological traits or behaviors. Each data point on the plot represents an individual, allowing researchers to identify patterns and trends in the data.
Written by Perlego with AI-assistance
Related key terms
1 of 5
9 Key excerpts on "Scatter Plots"
 eBook - PDF
Psychology of Personality
Viewpoints, Research, and Applications
- Bernardo J. Carducci(Author)
- 2015(Publication Date)
- Wiley(Publisher)
By contrast, the major purpose of corre- lational research is to investigate the extent to which Research Methods in Personality Psychology 21 any two variables are associated with one another. For example, a researcher might be interested in studying the relationship between shyness and loneliness or the need for achievement and worker productivity. The Scatter Plot: The Illustrating of Relationships A scatter plot is a graph summarizing the scores obtained by many individuals on two different vari- ables. Figure 1.2a is a scatter plot showing the relation- ship between scores on a measure of shyness and a mea- sure of loneliness. Each point on the scatter plot rep- resents an individual’s score for the two different vari- ables. For example, the point on the scatter plot corre- sponding to Mike’s scores indicates a score of 12 on the measure of loneliness and 20 on the measure of shyness. Interpreting correlational relationships involves iden- tifying the direction and strength of the relationship between the two variables. Correlational Relationships: Identifying Associations The direction of a correlational relationship reveals how the two variables are related. The two basic patterns indicating direction are the positive and negative corre- lational relationships. The general pattern of association of a positive correlational relationship reveals that as the scores on one variable increase, the correspond- ing scores on the other variable also tend to increase. Figure 1.2a shows that as the loneliness scores increase, the corresponding shyness scores also tend to increase. The general pattern of association of a negative corre- lational relationship reveals that as the scores on one variable increase, the corresponding scores on the other variable tend to decrease. Figure 1.2b shows that as the shyness scores increase, the corresponding self-esteem scores tend to decrease. No longer available |Learn more
- Jessica Utts, Robert Heckard(Authors)
- 2015(Publication Date)
- Cengage Learning EMEA(Publisher)
Our ability to predict what happens for an individual depends on the amount of natural variability from that pattern.” Copyright 2014 Cengage Learning. All Rights Reserved. May not be copied, scanned, or duplicated, in whole or in part. Due to electronic rights, some third party content may be suppressed from the eBook and/or eChapter(s). Editorial review has deemed that any suppressed content does not materially affect the overall learning experience. Cengage Learning reserves the right to remove additional content at any time if subsequent rights restrictions require it. 70 Chapter 3 Unless otherwise noted, all content on this page is © Cengage Learning. 3.1 Looking for Patterns with Scatterplots A scatterplot is a two-dimensional graph of the measurements for two numerical vari-ables. A point on the graph represents the combination of measurements for an indi-vidual observation. The vertical axis, which is called the y axis, is used to locate the value of one of the variables. The horizontal axis, called the x axis , is used to locate the value of the other variable. As we learned in Chapter 2, when looking at relationships, we can often identify one of the variables as an explanatory variable that may explain or cause differences in the response variable . The term dependent variable is used as a synonym for response variable because the value for the response variable may depend on the value for the explanatory variable . In a scatterplot, the response variable is plotted on the vertical axis (the y axis), so it may also be called the y variable . The explanatory variable is plot-ted along the horizontal axis (the x axis) and may be called the x variable . eBook - PDF
- Geoff Der, Brian S. Everitt(Authors)
- 2012(Publication Date)
- Chapman and Hall/CRC(Publisher)
Two elements of the shape of a scatter plot that are most useful in describing relationships between variables are measures of ‘location’ and ‘spread’. For example, location might be measured as a line or a curve that runs through the bulk of the data, while spread might be measured in terms of deviations of ( x, y ) points from the estimated location. 188 Applied Medical Statistics Using SAS The simple xy scatter plot has certainly been in use for a long time—at least from the eighteenth century, and it has many virtues, indeed, according to Tufte (1983): The relational graphic—in its barest form the scatterplot and its variants—is the greatest of all graphical designs. It links at least two variables encouraging and even imploring the viewer to assess the possible causal relationship between the plotted variables. It confronts causal theories that x causes y with empirical evidence as to the actual relationship between x and y. Now let’s have a look at an example of a scatter plot. For this we will use the data shown in Table 7.1, which were collected in a study investigating the pos-sible link between alcohol consumption and the death rate per 100,000 of the population from cirrhosis and alcoholism (data collected before West Germany ceased to exist as a separate country).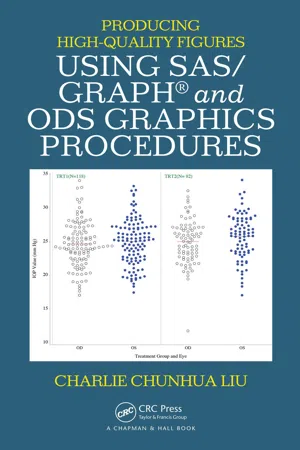
- Charlie Chunhua Liu(Author)
- 2015(Publication Date)
- Chapman and Hall/CRC(Publisher)
51 4 Scatter and Jittered Scatter Plots 4.1 Introduction A scatter plot is “a type of diagram using Cartesian coordinates to display values for two variables for a set of data. The data is displayed as a collec-tion of points, each having the value of one variable determining the posi-tion on the horizontal axis and the value of the other variable determining the position on the vertical axis” (Wikipedia). Scatter Plots are often used to visualize all individual data points, not just mean values as in line plots. In many circumstances, Scatter Plots might be preferred to line plots because they allow us to visualize all data points, including outliers. A scatter plot is a good example of letting the data speak for themselves, one important prin-ciple for data visualization and exploration (Tufte, 1983, 1997, 2006). For scatter pots with discrete values in one axis, such as treatment group, gender, or age group, and continuous values in the other axis, the continu-ous values might be too close to each other to be separated or visually dis-tinguished in the plots. A jittered scatter plot can be used in these scenarios. A jittered scatter plot is a type of scatter plot where the values on one axis (usually the discrete value at the horizontal) are randomly jittered away from each other within a range so the values in the other axis (usually continuous variables in the vertical axis) can be separated to be visually distinguished. The sample scatter and jittered Scatter Plots are produced using both PROC GLOT and PROC SGPLOT procedures. The features, pros, and cons that are associated with the two procedures used to produce the Scatter Plots are discussed. SAS programs used to produce the sample figures are discussed and included in the Appendix (Section 4.6).
- Michael Friendly, Howard Wainer(Authors)
- 2021(Publication Date)
- Harvard University Press(Publisher)
6 The Origin and Development of the Scatterplot As we saw in Chapter 5, most modern forms of data graphics—pie charts, line graphs, and bar charts—can generally be attributed to William Playfair in the period 1785–1805. All of these, even though presented as two-dimensional graphs, were essentially one-dimensional in their view of data. They showed a single quantitative variable (such as land area or value of trade) broken down by a categorical variable, as in a pie chart or bar chart, or plotted over time (perhaps with separate curves for imports and exports), as in a line graph. In the development of a language and taxonomy of graphs, Playfair’s graphs and other visual representations of data in this time can considered 1.5D— more than just a single variable shown, but not quite enough to qualify for 2D status. In Playfair’s visual understanding, the horizontal axis in his plots most often bound to time, forcing him to use other means to show relations with other variables. The next major invention in data graphics—the first fully two-dimensional one—was the scatterplot. Indeed, among all forms of statistical graphics, the scatterplot may be considered the most versatile and generally useful inven- tion in the entire history of statistical graphics. 1 Essential characteristics of a scatterplot are that two quantitative variables are measured on the same observational units (workers); the values are plotted as points referred to perpendicular axes; and the goal is to show something about the relation between these variables, typically how the ordinate variable, y, varies with the abscissa variable, x. Figure 6.1 shows a typical, if simplistic, modern scatterplot. It relates the number of years of experience of some workers on the horizontal (x) axis to their current annual salary on the vertical (y) axis. The experience and salary eBook - ePub
- Bruce J. Chalmer(Author)
- 2020(Publication Date)
- CRC Press(Publisher)
11Describing Relationships Between Two Variables
11.1 A scatterplot shows the shape of a relationship between two variables.
Relationships between variables
Before we discuss ways of describing relationships between variables, we need to consider why we should bother. The answer is the same as it was when we considered group differences on a single variable: Many scientific hypotheses can be stated in terms of the relationship between two variables. In fact, the issue of group differences can itself be considered in terms of a relationship between two variables and some of the same techniques apply, as we will see.What do we mean by a “relationship” between variables? To say that two variables are related means that knowledge of an individual's score on one variable changes our best guess about the individual's score on the other variable.For example, yield of com per hectare and amount of rainfall during the growing season are presumably related to each other. If we knew nothing else about a given farm (besides the fact that com was planted there), our best guess about the yield we might expect from that farm would simply be the average com yield. But if we were given information about the rainfall at the farm, our guess would probably be affected. If we were told that there is almost no rain at the farm, then, in the absence of irrigation, we would expect a very low yield. If we were told that there is too much rain, we would similarly expect a low yield. If we were told that the amount of rain is just right for com, we would expect a high yield.Figure 11.1 shows a graphical representation of this type of relationship. By drawing such a picture, we can characterize the “shape” of a relationship. In this case it is curvilinear: High com yields are associated with moderate rainfall, with lower yields for very high or very low rainfall.Scatterplots
Of course, Figure 11.1 is unrealistic. Even though rainfall undoubtedly does affect com yield, it is not the only factor. Many other things matter also. Knowing the amount of rainfall would change our best guess about com yield, but we still would not be able to predict com yield perfectly eBook - ePub
Statistics for Psychologists
An Intermediate Course
- Brian S. Everitt(Author)
- 2001(Publication Date)
- Psychology Press(Publisher)
does emerge, and a dependence of failure on temperature is revealed.To end the chapter on a less sombre note, and to show that misperception and miscommunication are certainly not confined to statistical graphics, see Figure 2.35 .2.10. SummaryFig. 2.35. Misperception and miscommunication are sometimes a way of life. (© The New Yorker collection 1961 Charles E. Martin from cartoonbank.com. All Rights Reserved.)- Graphical displays are an essential feature in the analysis of empirical data.
- In some case a graphical “analysis” may be all that is required (or merited).
- Stem-and-leaf plots are usually more informative than histograms for displaying frequency distributions.
- Box plots display much more information about data sets and are very useful for comparing groups. In addition, they are useful for identifying possible outliers.
- Scatterplots are the fundamental tool for examining relationships between variables. They can be enhanced in a variety of ways to provide extra information.
- Scatterplot matrices are a useful first step in examining data with more than two variables.
- Beware graphical deception!
Pie charts, bar charts, and the like are easily constructed from the Graph menu. You enter the data you want to use in the chart, select the type of chart you want from the Graph menu, define how the chart should appear, and then click OK. For example, the first steps in producing a simple bar chart would be as follows.- Enter the data you want to use to create the chart.
- Click Graph, then click Bar. When you do this you will see the Bar Charts
- Martin Lee Abbott(Author)
- 2016(Publication Date)
- Wiley(Publisher)
Violations of this assumption might include “curvilinear” relationships in which plotted data appear to be in the form of a “U” pattern. For example, with the age and value of a car, the lin- ear relationship might change over time since really old cars increase in value. You can see this pattern in a scattergram, which I will discuss later. Formally, you can detect “curvilinear” relationships through SPSS ® . It should be noted that correlation is a robust test, which means that it can pro- vide meaningful results even if there are some slight violations of these assumptions. However, some assumptions are more important than others in this regard, as you will see. PLOTTING THE CORRELATION: THE SCATTERGRAM I mentioned the scattergram in discussing the assumption of linearity earlier. Var- iously known as “scatter diagram,” “scatterplot,” “scatter graph,” or simply “scat- tergram,” you can create a visual graph that shows the relationship between two variables. Figure 11.2 shows the scattergram between the two example variables, IncomeOP and HealthOP. As you can see, the dots on the graph are displayed from the lower left side of the plot to the upper right side. This pattern indicates a positive correlation because the values of one variable increase in value as the values of the other variable increase. Reading the plot is straightforward. The values in the table of data are presented in pairs with each pair representing a single respondent’s values on both variables. Thus, PLOTTING THE CORRELATION: THE SCATTERGRAM 335 1 1 2 3 4 5 OPINION OF FAMILY INCOME HEALTH OPINION 2 3 4 5 Figure 11.2 The scattergram between health and income. the top pair of values in Table 11.2 indicates a respondent who indicated opinions that their income was average (value of 3) and that their health was good (value of 3). I filled in the dot in Figure 11.2 to show the pair of scores for the tenth respondent in Table 11.2 (the respondent indicating above average income and fair health). eBook - PDF
Regression Graphics
Ideas for Studying Regressions Through Graphics
- R. Dennis Cook(Author)
- 2009(Publication Date)
- Wiley-Interscience(Publisher)
C H A P T E R 2 Introduction to 2D Scatterplots Two-dimensional (2D) scatterplots can be effective for obtaining an initial impression of regression data, particularly with the aid of various graphical enhancements such as scatterplot smoothen. We begin the study of 2D scatter- plots in the context of a simple regression problem with univariate response y and univariate predictor x, assuming throughout that the data (y& are independent and identically distributed realizations on the bivariate random variable (y,x). A variety of miscellaneous topics is introduced in this chap ter, including smoothing, transforming the response for linearity, visualizing exchangeable data, and scatterplot matrices. To provide a little historical per- spective, the work of Mordecai Ezekiel and Louis Bean on graphically fitting generalized additive models is discussed near the end of this chapter. When V and H are scalars, the notation { V , H } indicates a 20 scatterplot with V on the vertical axis and H on the horizontal axis. 2.1. RESPONSE PLOTS IN SIMPLE REGRESSION There are three primary reasons for inspecting the 2D response plot { y , x } in simple regression problems: to study the bivariate distribution of tv,x), . to study how properties of y 1 (x = x,) vary with x,, and to identify outliers and other anomalies in the data. fnverse regression, the study of the conditional distribution of x I y, may be rel- evant in some problems as well. In this chapter we focus mostly on properties of the forward regression y 1 x. Initial impressions of a 2D response plot are often sufficient to decide if the data contradict the possibility that y An. When the distribution of y I x depends on the value of x , interest usually centers on the regressionfunction E(y I x) and on the vuriuncefunction Varb I x). Studying higher-order moments graphically seems difficult without fairly large sample sizes, although skewness can often be detected visually. 14
Index pages curate the most relevant extracts from our library of academic textbooks. They’ve been created using an in-house natural language model (NLM), each adding context and meaning to key research topics.